Coding
Coding Revision
Coding
(Note: This topic is Edexcel only.)
Coding is where something is done to every data value to make them easier to work with. Indeed, we can add, subtract, multiply and divide our data values, and as long as we do the same thing to each data value, the mean and standard deviation of the new set can tell us the mean and standard deviation of the original values.
There are three skills you need to know for coding.
Skill 1: Coding With Raw Data
To code a data point x, we turn it into y=\dfrac{x-a}{b} where a and b are of our choosing. Then we can work with our new data set y to get information about our original x.
Recall notation: \text{mean of }x=\bar{x} and \text{variance of }x= \text{var}(x)
To get information about x from our coded set y, we have the following formulas:
\bar{y}=\dfrac{\bar{x}-a}{b}
\text{var}(y)=\dfrac{\text{var}(x)}{b^{2}}
Example: Find the mean and variance of 14010,14030,14040,14060
If we use the coding y=\dfrac{x-14000}{10} we get y=1,3,4,6, which is much easier to work with.
So, find the mean and variance of the y values:
\bar{y}=\dfrac{1+3+4+6}{4}=3.5
\text{var}(y)=\dfrac{1^{2}+3^{2}+4^{2}+6^{2}}{4}-3.5^{2}=\dfrac{1+9+16+36}{4}-12.25=\dfrac{62}{4}-12.25=15.5-12.25=3.25
Then, find the mean of the original values:
3.5=\dfrac{\bar{x}-14000}{10}
\bar{x}-14000=35
\bar{x}=14035
and the variance of the original values:
3.25=\dfrac{\text{var}(x)}{10^{2}}
\text{var}(x)=325
So the mean and variance of 14010,14030,14040,14060 is 14035 and 325
Skill 2: Coding With Summarised Data
We can also apply coding to simplify summarised data to calculate the mean and variance.
Example: Suppose we have \sum{(x-100)}=18 and \sum{(x-100)^{2}}=45 with ten data points.
The obvious coding to try is y=x-100
This gives \sum{y}=18 and \sum{y^{2}}=45
So, the mean and variance of the y values are:
\bar{y}=\dfrac{18}{10}=1.8
\text{var}(y)=\dfrac{45}{10}-1.8^2=4.5-3.24=1.26
This gives results of:
\bar{x}= \bar{y} +100 = 1.8 + 100 = 101.8
and
\text{var}(x)= \text{var} (y) = 1.26
(the variance of x is the same as the variance of y, since we only subtracted 100 from each number).


A Level Maths Predicted Papers 2024
The MME A level maths predicted papers are an excellent way to practise, using authentic exam style questions that are unique to our papers. Our examiners have studied A level maths past papers to develop predicted A level maths exam questions in an authentic exam format. The profit from every pack is reinvested into making free content on MME, which benefits millions of learners across the country.

A Level Maths Revision Cards
The best A level maths revision cards for AQA, Edexcel, OCR, MEI and WJEC. MME is here to help you prepare effectively for your A Level maths exams. The profit from every pack is reinvested into making free content on MME, which benefits millions of learners across the country.


Skill 3: Coding With Grouped Data
We can code grouped data by coding the midpoint and calculating all our sums with the coded midpoint, then converting back at the end.
Example: Estimate the mean and variance of the heights of the teachers at a school from the following table.

Step 1: Find the midpoints.

Step 2: Choose a suitable coding for the midpoints. Here we should go for y=\dfrac{x-1.55}{0.1}. Now add the coded midpoints to the table.

Step 3: Proceed normally with the coded values, by adding an fy column and an fy^{2} column to the table.

Step 4: Calculate the mean and variance estimates for y.
\bar{y}=\dfrac{87}{50}=1.74
\text{var}(y) =\dfrac{191}{50}-1.74^{2}=3.82-3.0276=0.7924
Step 5: Use the coding formulas to turn these into values for x.
1.74=\dfrac{\bar{x}-1.55}{0.1}
\bar{x}-1.55=0.174
\bar{x}=1.724
0.7924=\dfrac{\text{var}(x)}{0.1^{2}}
\text{var}(x)=0.007924
Coding Example Questions
Question 1: By applying a suitable coding, find the mean and standard deviation of the data set
1000,1010,1030,1040,1070
[4 marks]
A suitable coding would be y=\dfrac{x-1000}{10}, which gives y=0,1,3,4,7 as the new data set.
\bar{y}=\dfrac{0+1+3+4+7}{5}=\dfrac{15}{5}=3
\text{var}(y)=\dfrac{0^{2}+1^{2}+3^{2}+4^{2}+7^{2}}{5}-3^{2}=\dfrac{1+9+16+49}{5}-9=\dfrac{75}{5}-9=15-9=6
3=\dfrac{\bar{x}-1000}{10}
\bar{x}-1000=30
\bar{x}=1030
6=\dfrac{\text{var}(x)}{10^{2}}
6=\dfrac{\text{var}(x)}{100}
\text{var}(x)=600
\text{var}(x) is the variance, while the question asked for standard deviation.
\sigma=\sqrt{600}=24.5 (3 sf)
Question 2: From the summary statistics below, find the mean and variance of x, provided that there are 8 data points.
\sum{\dfrac{x-4}{12}}=24
\sum{\left(\dfrac{x-4}{12}\right)^{2}}=120
[2 marks]
Clearly, we should use the encoding y=\dfrac{x-4}{12} to get:
\sum{y}=24
\sum{y^{2}}=120
So:
\bar{y}=\dfrac{24}{8}=3
\text{var}(y)=\dfrac{120}{8}-3^{2}=15-9=6
Now convert back to x:
3=\dfrac{\bar{x}-4}{12}
\bar{x}-4=36
\bar{x}=40
6=\dfrac{\text{var}(x)}{12^{2}}
6=\dfrac{\text{var}(x)}{144}
\text{var}(x)=864
Question 3: Use a suitable encoding to estimate the mean and variance of the grouped data presented below.
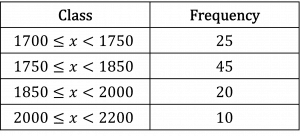
[6 marks]
Step 1: Find the midpoints of each class and add them to the table.

Step 2: Choose a suitable coding. In this case, there are a few possibilities, but the one shown here is y=\dfrac{x-1725}{25}.

Step 3: Proceed to create the rest of the table, with an fy and an fy^{2} column.
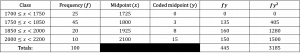
Step 4: Calculate the mean and variance for y.
\bar{y}=\dfrac{445}{100}=4.45
\text{var}(y)=\dfrac{3185}{100}-4.45^{2}=31.85-19.8025=12.0475
Step 5: Convert back into x values.
4.45=\dfrac{\bar{x}-1725}{25}
\bar{x}-1725=111.25
\bar{x}=1836.25
12.0475=\dfrac{\text{var}(x)}{25^{2}}
12.0475=\dfrac{\text{var}(x)}{625}
\text{var}(x)=7529.6875 or 7530 to 3 significant figures.
You May Also Like...

MME Learning Portal
Online exams, practice questions and revision videos for every GCSE level 9-1 topic! No fees, no trial period, just totally free access to the UK’s best GCSE maths revision platform.
