Function Graphs
Function Graphs Revision
Function Graphs
You have so far seen graphs of straight lines, quadratics and cubics. Now it is time to see some graphs of more complicated functions, such as graphs of y = kx^n and quartics. As before, you will only need to draw a rough sketch of these graphs.
Graphs of y = kx^n
Graphs of y = kx^n have the same basic shape, however the values of k and n affect how they look.
Here are some examples:

n positive and even
The graphs are either:
- u-shaped if k is positive
- n-shaped if k is negative

n positive and odd
The graphs either go:
- bottom-left to top-right if k is positive
- top-left to bottom-right if k is negative
(the graphs go ‘corner-to-corner’)

n negative and even
The graphs are mirror images in the y-axis, and are:
- above the x-axis if k is positive
- below the x-axis if k is negative

n negative and odd
The parts of the graph are in diagonally opposite quadrants, and are:
- in the bottom-left and top-right quadrants if k is positive
- in the top-left and bottom-right quadrants if k is negative
Note: an asymptote is a line that the curve gets infinitely close to, but never touches. The third and fourth graphs both have asymptotes at x=0 and y=0.
A Level Maths Predicted Papers 2024
The MME A level maths predicted papers are an excellent way to practise, using authentic exam style questions that are unique to our papers. Our examiners have studied A level maths past papers to develop predicted A level maths exam questions in an authentic exam format. The profit from every pack is reinvested into making free content on MME, which benefits millions of learners across the country.

A Level Maths Revision Cards
The best A level maths revision cards for AQA, Edexcel, OCR, MEI and WJEC. MME is here to help you prepare effectively for your A Level maths exams. The profit from every pack is reinvested into making free content on MME, which benefits millions of learners across the country.


Quartics
A quartic is a polynomial with an x^4 term as the highest power. To sketch a quartic, you will need to find where the curve crosses or touches the x-axis – the expression will be usually factorised which will make it easier to find these values.
Quartics with positive x^4 coefficients are positive for very positive and very negative x-values. Quartics with negative x^4 coefficients are negative for very positive and very negative x-values.
Example: Sketch the graph of f(x) = x^2(x-1)(x+2)

Let f(x)=0 to find the points where the curve crosses the x-axis:
x^2(x-1)(x+2) = 0
x^2 is a double root, so the graph touches the x-axis at \textcolor{red}{0}
The curve crosses the x-axis at \textcolor{red}{1} and \textcolor{red}{-2}
Substitute in x=0 to find where the curve crosses the y-axis:
y = 0^2(0-1)(0-2) = \textcolor{red}{0}
The coefficient of x^4 is positive, so the curve will be positive for very positive and very negative x-values.
Hence, we have enough information to sketch the graph.
Function Graphs Example Questions
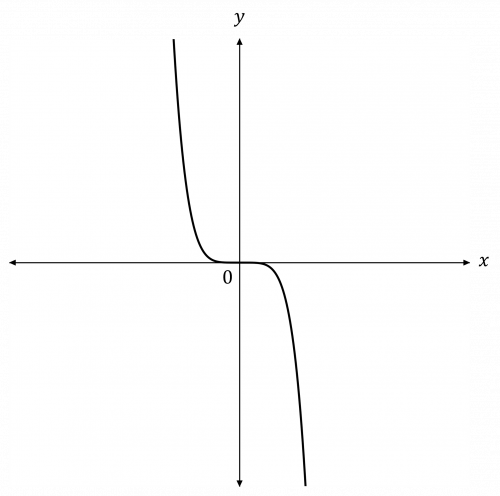
Question 1: Sketch the graph of y=-2x^5, labelling any points of intersection with the axes.
[2 marks]
The value of n is positive and odd (5), and the value of k is negative (-2).
Hence, the graph will have a corner-to-corner shape from top-left to bottom-right.
The graph will pass through the origin.
Therefore, the graph will look like this:
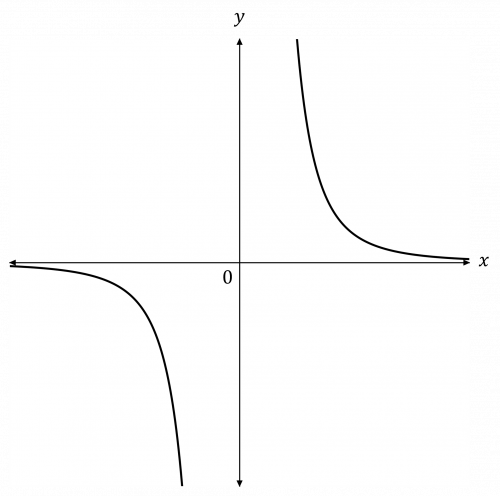
Question 2: Sketch the graph of y=\dfrac{4}{x^{3}}, labelling any points of intersection with the axes.
[2 marks]
The value of n is negative and odd (-3), and the value of k is positive (4).
Hence, the graph will be in the bottom-left and top-right corner.
Therefore, the graph will look like this:
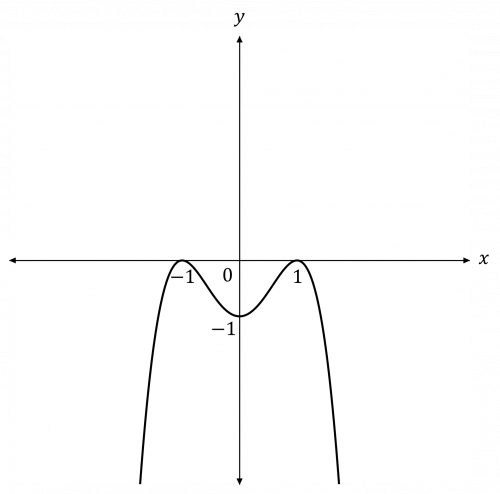
Question 3: Sketch the graph of y=-(x-1)^2 (x+1)^2, labelling any points of intersection with the axes.
[3 marks]
The coefficient of x^4 is negative, therefore the curve will be negative for very positive and very negative x-values.
Find the points where the curve crosses the x-axis:
-(x-1)^2 (x+1)^2 = 0
(x-1)^2 and (x+1)^2 are both double roots, therefore the curve will touch the x-axis at x=1 and x=-1
Find the point where the curve intersects the y-axis:
y = -(0-1)^2 (0+1)^2 = -1
Therefore, we have enough information to sketch the graph:
Function Graphs Worksheet and Example Questions
Curve Sketching
A LevelYou May Also Like...

MME Learning Portal
Online exams, practice questions and revision videos for every GCSE level 9-1 topic! No fees, no trial period, just totally free access to the UK’s best GCSE maths revision platform.
