Grouped Data
Grouped Data Revision
Grouped Data
Grouped data is represented in a histogram or frequency polygon. We can use histograms to estimate the mean, median and standard deviation of data sets.
Make sure you are happy with the following topics before continuing.
Estimation from Histograms
(Note: for guidance on how to draw histograms, see Presenting Data.)
Since histograms collate data, it may seem impossible to answer questions such like how many data points are greater than 9, unless 9 is a class boundary. We can, however, estimate the answers to these questions by assuming frequency is evenly distributed across an entire class. Here is how to do it:
Example: Approximately how many values are greater than 12 in this histogram?

Draw a line at 12 on the x axis. This will split the second block. Then, the area of the graph to the right of the line is our estimate. In this case, the second block now extends from 12 to 20, with a height of 2, so a frequency of 2\times 8=16 comes from the second block. The third block has a length of 10 and a height of 3, so gives 30 frequency. In total, there are 16+30=46 values larger than 12.

Frequency Polygon
A frequency polygon is another way to represent grouped data. It is a line graph joining the points with co-ordinates (midpoint of class, frequency).
Example:

The midpoints are 5,14,21,25,33, so we plot the points:
(5,9)
(14,15)
(21,17)
(25,9)
(33,4)
and connect them with straight lines.


Estimating the Mean and Standard Deviation from a Histogram
Previously, when we used frequency tables to find the mean and standard deviation, we looked at x, fx and fx^{2}. While we clearly still have f, it is not obvious how we should get x. This is where the idea of midpoints comes in again.
To estimate the mean and standard deviation from a histogram, first turn the histogram into a table, then add a column of the midpoints of each class labelled x. Then, create columns fx and fx^{2} and find the totals of all of the columns. Finally, use these totals in the formulas for mean and standard deviation.
Recall: The formulas:
\text{mean}=\dfrac{\sum{fx}}{\sum{f}}
\text{variance}=\dfrac{\sum{fx^{2}}}{\sum{f}}-\text{mean}^{2}
\text{standard deviation}=\sqrt{\text{variance}}
Estimating the Median from a Histogram
To estimate the median from a histogram we use linear interpolation. This is where we assume that within each block, the frequency is evenly spaced.
To find the median, first find \sum{f} and divide it by 2 to find the position of the median (since this is an estimate, if we obtain a decimal we can treat it as if it is a whole number position). Then, find which block the position falls into. Then, within that block, find where it lies.
For example, if the median is the 7th position of a block with 10 values of length 5, then you would add \dfrac{7\times 5}{10}=3.5 to the lower bound of the block to find the median.
A Level Maths Predicted Papers 2024
The MME A level maths predicted papers are an excellent way to practise, using authentic exam style questions that are unique to our papers. Our examiners have studied A level maths past papers to develop predicted A level maths exam questions in an authentic exam format. The profit from every pack is reinvested into making free content on MME, which benefits millions of learners across the country.

A Level Maths Revision Cards
The best A level maths revision cards for AQA, Edexcel, OCR, MEI and WJEC. MME is here to help you prepare effectively for your A Level maths exams. The profit from every pack is reinvested into making free content on MME, which benefits millions of learners across the country.


Example 1: Estimating the Mean and Standard Deviation from a Histogram
Find the mean and standard deviation of the data in the histogram below.
[6 marks]

Step 1: Create a table of the data from the histogram.

Step 2: Add columns for the midpoint (x), fx and fx^{2}.

Step 3: Use the formulas to find the mean and standard deviation.
\begin{aligned}\text{mean}&=\dfrac{\sum{fx}}{\sum{f}}\\[1.2em]&=\dfrac{138.5}{31}=4.47\\[1.2em]\text{variance}&=\dfrac{\sum{fx^{2}}}{\sum{f}}-\text{mean}^{2}\\[1.2em]&=\dfrac{759.75}{31}-4.47^{2}\\[1.2em]&=4.55\\[1.2em]\text{standard deviation}&=\sqrt{\text{variance}}\\[1.2em]&=\sqrt{4.55}\\[1.2em]&=2.13\end{aligned}
Example 2: Estimating the Median from a Histogram
Find the median of the data in the histogram from the previous example.
[3 marks]
There are 31 data points, so the median is the 15.5th data point. We can treat the decimal like it is a whole number position for our estimate. There are 15 data points in the first two blocks, so this falls 0.5 data points into the third block. Said block contains 8 data points and has a width of 1. So we are \dfrac{1\times 0.5}{8}=0.0625, so we are 0.0625 into the block. The block starts at 5, so the median is 5.0625.
Grouped Data Example Questions
Question 1: Create a histogram from the following table.

[4 marks]

Question 2: If \sum{f}=18, \sum{fx}=162 and \sum{fx^{2}}=2430, what is the variance?
[2 marks]
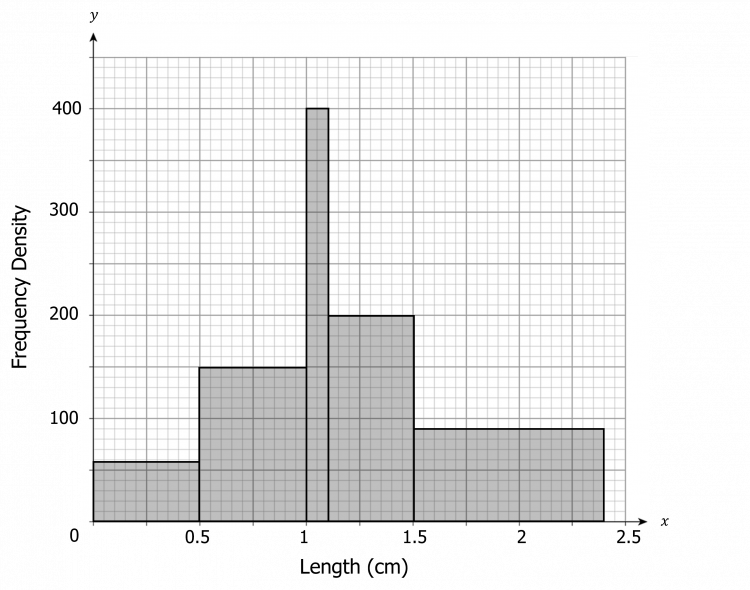
Question 3: Consider this histogram.
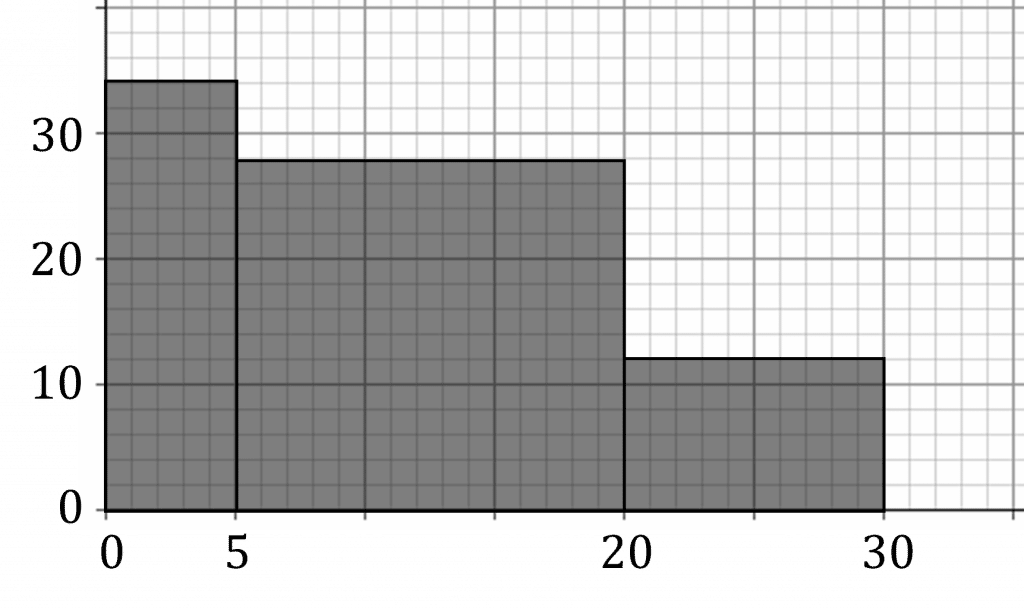
a) Estimate how many values are greater than 15.
b) Turn the values in the histogram into a frequency table.
c) What is the mean and standard deviation of the data in the histogram?
d) What is the median of the data in the histogram?
[10 marks]
a) A line at 15 would split the second block. To the right of 15 in this block is a width of 5 and a height of 28, for a total of 5\times 28=140 frequency. The third block has a width of 10 and a height of 12, for a total of 10\times 12=120 frequency. Overall, the number of values greater than 15 is 140+120=260
b)
c) Step 1: Using the table from the second question, create a table containing totals, midpoints, fx and fx^{2}.
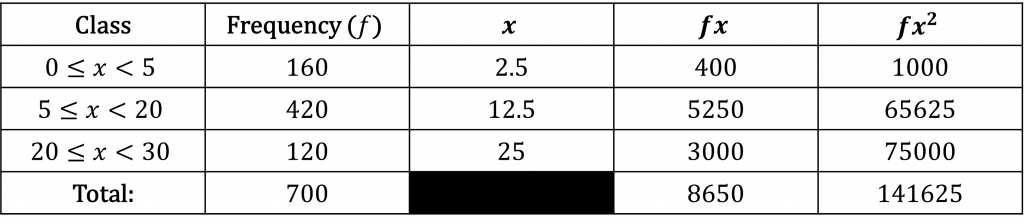
Step 2: Use the formulas to find the mean and standard deviation.
\text{mean}=\dfrac{\sum{fx}}{\sum{f}}=\dfrac{8650}{700}=12.4
\text{variance}=\dfrac{\sum{fx^{2}}}{\sum{f}}-\text{mean}^{2}=\dfrac{141625}{700}-12.4^{2}=49.6
\text{standard deviation}=\sqrt{\text{variance}}=\sqrt{49.6}=7.04
d) The median is the 350th value, which falls within the second block. Since 160 values are in the first block, this is the 190th value of the second block. The second block has a width of 15 and a frequency of 420. So position 190 is
\dfrac{190\times 15}{420}=\dfrac{95}{14}Adding on the original 5 from the width of the first block gives a value of \dfrac{165}{14}, which is our median.
Grouped Data Worksheet and Example Questions
Single Variable Data and Histograms
A LevelYou May Also Like...

MME Learning Portal
Online exams, practice questions and revision videos for every GCSE level 9-1 topic! No fees, no trial period, just totally free access to the UK’s best GCSE maths revision platform.
