Outliers and Interquartile Range
Outliers and Interquartile Range Revision
Interquartile Range
Recall: The range is equal to the highest value subtract the lowest value.
The range is a measure of variation (how spread out the data is). It is affected severely by extreme values and outliers. To handle this problem, we introduce the interquartile range.
Quartiles and the Interquartile Range
Quartiles are values that split the data into four, in the same way that the median splits the data into two (in fact, the median is the second quartile).
Recall: To find the median, we find \dfrac{n}{2}, where n is the frequency. If this is a whole number the median is the average of this term and the one above. If this is not a whole number we round the number up to find the position of the median term.
We find quartiles in very similar ways.
The first (or lower) quartile is calculated from \dfrac{n}{4}. If this is a whole number then the first quartile is the average of this term and the term above. If this is not a whole number then we round the number up to find the position of the first quartile.
The third (or upper) quartile is calculated from \dfrac{3n}{4}. If this is a whole number then the third quartile is the average of this term and the term above. If this is not a whole number then we round the number up to find the position of the third quartile.
Note: We always round up to find the position of the quartile, even if \dfrac{n}{4} or \dfrac{3n}{4} would usually be rounded down.
Finally we define the interquartile range:
\text{interquartile range}=\text{third quartile}-\text{first quartile}
Outliers
The interquartile range provides a method to deal with outliers. Since it is not calculated using any outliers because it is the range of the middle half of the data, it is sensible to say that an outlier is a certain multiple of the interquartile range below the first quartile or above the third quartile. An exam question might, for example, provide a data set and ask you to calculate the interquartile range and find outliers.
Note: The particular multiplier you need to use to identify any outliers will be given to you in the question.


A Level Maths Predicted Papers 2024
The MME A level maths predicted papers are an excellent way to practise, using authentic exam style questions that are unique to our papers. Our examiners have studied A level maths past papers to develop predicted A level maths exam questions in an authentic exam format. The profit from every pack is reinvested into making free content on MME, which benefits millions of learners across the country.

A Level Maths Revision Cards
The best A level maths revision cards for AQA, Edexcel, OCR, MEI and WJEC. MME is here to help you prepare effectively for your A Level maths exams. The profit from every pack is reinvested into making free content on MME, which benefits millions of learners across the country.


Example 1: The Interquartile Range
Consider the data set 1,4,5,5,6,6,6,6,7,10,12. What is the interquartile range?
[2 marks]
There are 11 data points. \dfrac{11}{4}=2.75, so the first quartile is in the third position, which is 5.
\dfrac{3\times 11}{4}=8.25, so the third quartile is in the 9th position, which is 7. So the interquartile range is 7-5=2.
Example 2: Outliers
Consider the data set 21,34,35,39,41,42,44. A data point is said to be an outlier if it is more than 1.5 times the interquartile range above the third quartile or below the first quartile. Identify any outliers.
[5 marks]
There are 7 data points. \dfrac{7}{4}=1.75, so the first quartile is in the second position, which is 34.
\dfrac{3\times 7}{4}=5.25, so the third quartile is in the 6th position, which is 42. So the interquartile range is 42-34=8.
Calculate boundaries for outliers: 1.5\times 8=12 so the lower boundary is 34-12=22 and the upper boundary is 42+12=56. The data value 21 falls outside of these boundaries, so it is an outlier. There are no other outliers.
Outliers and Interquartile Range Example Questions
Question 1: What is the interquartile range of this data set?
3,11,21,30,38,49,51,54
[2 marks]
There are 8 data points. \dfrac{8}{4}=2 so for the lower quartile we average the second and third points, which is \dfrac{11+21}{2}=16. \dfrac{3\times 8}{4}=6 so for the upper quartile we average the sixth and seventh points, which is \dfrac{49+51}{2}=50. So the interquartile range is 50-16=34.
Question 2: Find the interquartile range of the data in this frequency table.
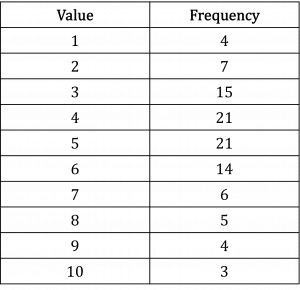
[4 marks]
There are 100 data points.
\dfrac{100}{4}=25 so the first quartile is the average of the 25th and 26th data points, both of which are 3; so the first quartile is 3.
\dfrac{3\times 100}{4}=75 so the third quartile is the average of the 75th and 76th data points, both of which are 6; so the third quartile is 6.
Note: in which value a data point falls can be seen easily with a cumulative frequency table.
The interquartile range is 6-3=3
Question 3: A value is said to be an outlier if it is more than 1.5 times the interquartile range above the third quartile or below the first quartile. How many outliers are there in the data set below?
4,16,36,44,46,48,48,49,49,49,\\50,52,54,55,56,58,63,72,81,99
[7 marks]
There are 20 data points.
\dfrac{20}{4}=5 so the first quartile is the average of the fifth and sixth data point, which is \dfrac{46+48}{2}=47
\dfrac{3\times 20}{4}=15 so the third quartile is the average of the 15th and 16th data point, which is \dfrac{56+58}{2}=57
The interquartile range is 57-47=10.
So our lower boundary is 47-1.5\times10=32 and our upper boundary is 56+1.5\times10=71.
4 and 16 lie outside the lower boundary, while 72, 81 and 99 lie outside the upper boundary, so there are five outliers overall.
Outliers and Interquartile Range Worksheet and Example Questions
Outliers and Cleaning Data
A LevelYou May Also Like...

MME Learning Portal
Online exams, practice questions and revision videos for every GCSE level 9-1 topic! No fees, no trial period, just totally free access to the UK’s best GCSE maths revision platform.
