Quadratic Graphs
Quadratic Graphs Revision
Quadratic Graphs
You will need to be able to identify and sketch quadratic graphs.
Make sure you are happy with the following topics before continuing.
Quadratic Graph Shapes
Quadratic graphs have the general form
\textcolor{red}{a} x^2 + \textcolor{blue}{b}x + \textcolor{limegreen}{c}
These can be either u-shaped (if \textcolor{red}{a} is positive) or n-shaped (if \textcolor{red}{a} is negative)
Some examples of quadratic graphs can bee seen below:

A Level Maths Predicted Papers 2024
The MME A level maths predicted papers are an excellent way to practise, using authentic exam style questions that are unique to our papers. Our examiners have studied A level maths past papers to develop predicted A level maths exam questions in an authentic exam format. The profit from every pack is reinvested into making free content on MME, which benefits millions of learners across the country.

A Level Maths Revision Cards
The best A level maths revision cards for AQA, Edexcel, OCR, MEI and WJEC. MME is here to help you prepare effectively for your A Level maths exams. The profit from every pack is reinvested into making free content on MME, which benefits millions of learners across the country.


Sketching Quadratic Graphs
To sketch quadratic graphs, you need to follow these steps:
Step 1: Decide whether the graph is an n-shape or a u-shape.
- u-shaped if the coefficient of x^2 is positive
- n-shaped if the coefficient of x^2 is negative
Step 2: Find the intersections with the x-axis (set y=0) and y-axis (set x=0)
Step 3: Find the maximum (if it is an n-shaped graph) or minimum (if it is a u-shaped graph) using symmetry or completing the square.
Step 4: Sketch the graph and label all the important points.
Example: Sketch the graph of y = 2x^2 + 3x - 2

Step 1: The coefficient of x^2 is positive, so the graph is u-shaped.
Step 2: When y=0,
\begin{aligned} 2x^2 + 3x - 2 &= 0 \\ (2x-1)(x+2) &= 0 \end{aligned}
x = \dfrac{1}{2} or x = -2
Hence, the curve crosses the x-axis at \textcolor{red}{\left( \dfrac{1}{2}, 0 \right)} and \textcolor{red}{(-2,0)}
When x = 0,
y = 2(0)^2 + 3(0) - 2 = -2
Hence, the curve crosses the y-axis at \textcolor{red}{(0,-2)}
Note: You can often read off the value the graph crosses the y-axis at (called the y-intercept) from the equation of a quadratic. The y-intercept of y=ax^{2}+bx+c is always c.
Step 3: The minimum value will be halfway between \left(\dfrac{1}{2}, 0 \right) and (-2,0):
\left( \dfrac{1}{2} - 2 \right) \div 2 = - \dfrac{3}{4}
So, the minimum value is at x = - \dfrac{3}{4}
Therefore, the minimum is
y = 2 \left(- \dfrac{3}{4} \right)^2 + 3 \left(- \dfrac{3}{4} \right) - 2 = - \dfrac{25}{8}
So, the graph has a minimum at the point \textcolor{red}{\left(- \dfrac{3}{4}, - \dfrac{25}{8} \right)}
Step 4: Sketch the graph (sketching doesn’t need to be to scale) and label all the important points.
Completing the Square to Sketch Graphs
You can complete the square to help sketch quadratic curves.
Example: Sketch the curve of y = 3x^2 - 12x + 7

Firstly, complete the square:
y = 3x^2 - 12x + 7 = 3(x-2)^2 - 5
When y=0,
\begin{aligned} 3(x-2)^2 - 5 &=0 \\ (x-2)^2 &= \dfrac{5}{3} \\ x - 2 &= \pm \sqrt{\dfrac{5}{3}} \\ x &= 2 \pm \dfrac{\sqrt{15}}{3} \end{aligned}
So, the curve crosses the x-axis at \textcolor{red}{\left(2-\dfrac{\sqrt{15}}{3},0 \right)} and \textcolor{red}{\left(2+\dfrac{\sqrt{15}}{3},0 \right)}
When x=0,
y = 3(0)^2 - 12(0) + 7 = 7
So, the curve crosses the y-axis at \textcolor{red}{(0,7)}
(x-2)^2 \geq 0 (since a square number is never less than 0), therefore the minimum value occurs at x-2=0 \Rightarrow x = 2, and therefore the minimum is
y = 3(2-2)^2 - 5
So, the minimum is at the point \textcolor{red}{(2, -5)}
Then, you have enough information to sketch the graph.
Note: You can read off the vertex of a graph from completed square form. The vertex of y=a(x+b)^{2}+c is always at (-b,c).
Functions with no Real Roots
Some functions have no real roots – i.e. its graph doesn’t cross the x-axis. You can complete the square and use this to see if quadratics have real roots, or not.
Example: f(x) = x^2 + 2x + 6. Determine whether f(x) has any real roots.
Complete the square:
f(x) = x^2 + 2x + 6 = \textcolor{red}{(x+1)^2} + \textcolor{blue}{5}
\textcolor{red}{(x+1)^2} is never less than 0, therefore the minimum of the curve of f(x) is at \textcolor{blue}{5}.
Hence, f(x) cannot be negative and will not cross the x-axis at any point.
Therefore, f(x) has no real roots.
Note: If the coefficient of x^2 is negative, you can do a similar thing to see if f(x) has real roots, by checking if f(x) is ever positive.
Quadratic Graphs Example Questions
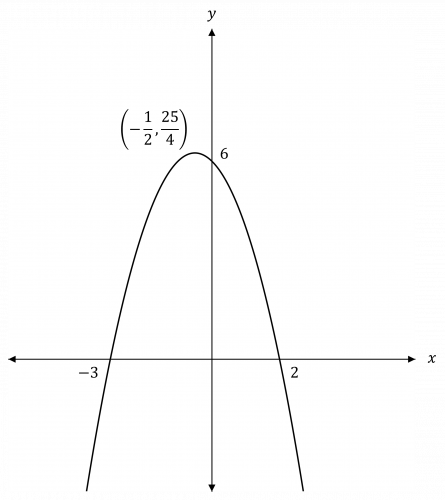
Question 1: Sketch the graph of y = 6 - x - x^2.
[4 marks]
The coefficient of x^2 is negative, so the graph is n-shaped.
When x = 0, y = 6
When y = 0,
\begin{aligned} 6 - x - x^2 &= 0 \\ (2-x)(x+3) &= 0 \end{aligned}
x = 2 or x = -3
The maximum value is halfway between -3 and 2. So the maximum is at x = - \dfrac{1}{2} and y = 6 - \left(- \dfrac{1}{2} \right) - \left(- \dfrac{1}{2} \right)^2 = \dfrac{25}{4}
So, we have enough information to plot the graph:
Question 2: f(x) = 2x^2 + 16x - 10. Complete the square to find the maximum or minimum point of its curve.
[4 marks]
The coefficient of x^2 is positive, so there will be a minimum.
\begin{aligned} f(x) &= 2x^2 + 16x - 10 \\ &= 2 \left(x+\dfrac{16}{2 \times 2} \right)^2 + \left(-10 - 2 \left(\dfrac{16}{2 \times 2}\right)^2 \right) \\ &= 2(x+4)^2 - 42 \end{aligned}
Hence, the minimum occurs at (x+4) = 0 \Rightarrow x = -4
So, the minimum is
f(-4) = 2(-4+4)^2 - 42 = -42
Hence, the graph has a minimum at the point (-4, -42)
Question 3: f(x) = -2x^2 - 8x - 12. Show that f(x)=0 has no real roots.
[3 marks]
\begin{aligned} f(x) &= -2x^2 - 8x - 12 \\ &= -(2x^2 + 8x + 12) \end{aligned}
Complete the square:
2x^2 + 8x + 12 \\ = 2 \left(x+\dfrac{8}{2 \times 2} \right)^2 + \left(12 - 2\left(\dfrac{8}{2 \times 2}\right)^2 \right) \\ = 2(x+2)^2 + 4
So, f(x) = - 2(x+2)^2 - 4
(x+2)^2 is never less than 0, therefore the maximum of the curve of f(x) is at -4.
Hence, f(x) cannot be positive and will not cross the x-axis at any point.
Therefore, the function has no real roots.
Quadratic Graphs Worksheet and Example Questions
Coordinate Geometry Curve
A LevelCurve Sketching
A LevelYou May Also Like...

MME Learning Portal
Online exams, practice questions and revision videos for every GCSE level 9-1 topic! No fees, no trial period, just totally free access to the UK’s best GCSE maths revision platform.
