Grouped Frequency Tables
Grouped Frequency Tables Revision
Grouped Frequency Tables
When there is a lot of data, it can be easier to separate the values into groups. We can then display the amount of data in each group in a grouped frequency table. We can also estimate the mean of a set of data from a grouped frequency table.
Make sure you are happy with the following topics before continuing:
Grouped Frequency Tables

This particular example is a set of data on the heights of a selection of adults. To understand what this table is saying, let’s look at the first group (also known as a class):
150<h\leq 160
This notation means that all people who fall within this group are
“taller than 150 cm but no taller than 160 cm.”
It’s important to understand that this group doesn’t include people who are exactly 150 cm tall, but it does include people who are exactly 160 cm tall.
This distinction matters, because we have to be clear about which group people on the edges of their class will fit into.
Note: Inequality Signs
The signs used for the inequalities are important.
A < sign attached to a number means the class does not include that number. In the table above we can see that the class 150<h\leq160 does not include people who are exactly 150\text{ cm} tall.
However, a \leq sign attached to a number means that the class does include that number. In the table above we can see that the class 150<h\leq160 does include people who are exactly 160\text{ cm} tall.
The reason for this is so that the class boundaries fall into exactly one class.
If we used < only, the class boundaries would not be included in any class, and someone who is exactly 160\text{ cm} tall would not fit into any group.
If we used \leq only, some class boundaries would appear in two classes, so we wouldn’t know which class to put someone who is exactly 160\text{ cm} tall in.
Estimating the Mean
Since we don’t know exactly the values of data in a grouped frequency table, we cannot calculate an exact mean. Instead, we can use the information we do have to find an estimate for the mean. We can work out an estimate for the mean as follows.
Step 1: Add two new columns to the table, one called midpoint and one called midpoint \times frequency.
Step 2: In the midpoint column, add the midpoint of each class.
Step 3: To calculate the values for the midpoint \times frequency column, find the product of the frequency and midpoint for each row.
Step 4: Find the totals of the frequency column, and the midpoint \times frequency column.
Step 5: The estimate for the mean is the total of the midpoint \times frequency column, divided by the total of the frequency column.
Note: This is only an estimate. The real mean could vary substantially from this.
Example: Estimate the mean of the diameters of the pans sold in a kitchenware shop.

Step 1: Add two new columns to the table, one called midpoint and one called midpoint \times frequency.

Step 2: In the midpoint column, add the midpoint of each class.

Step 3: To calculate the values for the midpoint \times frequency column, find the product of the frequency and midpoint for each row.

Step 4: Find the totals of the frequency column, and the midpoint \times frequency column.

Step 5: The estimate for the mean is the total of the midpoint \times frequency column, divided by the total of the frequency column.
465\div31=15So the estimate for the mean is 15\text{ cm}.
Example 1: Median and Mode from a Grouped Frequency Table

The grouped frequency table on the right shows the weights of 117 cats.
Find the modal class and the median class.
[3 marks]
The modal class is the class with the highest frequency, which in this case is 3.5<w\leq4.
The median class is the class containing the median value. Since there are 117 cats, the median cat will be in the 59^{\text{th}} position.
Since 22+14=36<59 and 22+14+39=75>59, the median class must be 3.5<w\leq4.
Example 2: Estimating the Mean

Cindy asked multiple people how many hours they have spent playing video games in the past week. She collects her results in a table, pictured on the right.
Use the table to estimate the mean time spent playing video games.
Give your answer to two decimal places.
[4 marks]
Step 1: Add two new columns to the table, one called midpoint and one called midpoint \times frequency.

Step 2: In the midpoint column, add the midpoint of each class.

Step 3: To calculate the values for the midpoint \times frequency column, find the product of the frequency and midpoint for each row.

Step 4: Find the totals of the frequency column, and the midpoint \times frequency column.

Step 5: The estimate for the mean is the total of the midpoint \times frequency column, divided by the total of the frequency column.
442/57=7.75 to two decimal places.
So the estimate for the mean is 7.75\text{ hrs}.
Example 3: Estimating the Mean
Data on several cats is shown in the grouped frequency table on the right.
Calculate an estimate for the mean of the weight of the cats.
Give your answer to one decimal place.
[4 marks]
Step 1: Add two new columns to the table, one called midpoint and one called midpoint \times frequency.

Step 2: In the midpoint column, add the midpoint of each class.

Step 3: To calculate the values for the midpoint \times frequency column, find the product of the frequency and midpoint for each row.

Step 4: Find the totals of the frequency column, and the midpoint \times frequency column.

Step 5: The estimate for the mean is the total of the midpoint \times frequency column, divided by the total of the midpoint column.
438.25/117=3.75 to two decimal places.
So the estimate for the mean is 3.75\text{ kg}.
Grouped Frequency Tables Example Questions
Question 1: A physics test is marked out of 60. The marks for 25 students are listed below.
6, 11, 21, 35, 44, 23, 37, 16, 42, 11, 47, 59, 45, 16, 13, 18, 19, 25, 15, 32, 54, 8, 38, 42, 53
a) Fill in the grouped frequency table below.
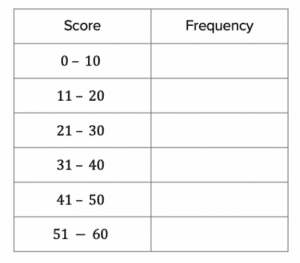
b) Find the percentage of the class that scored above 40 marks.
[3 marks]
a) The completed frequency table is as follows:
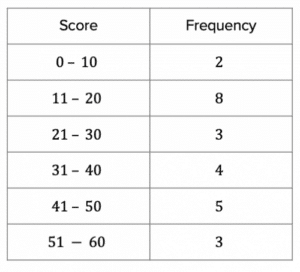
b) The students who scored above 40 are those in the 41-50 and 51-60 classes of the table, which is 5+3=8 students.
8\div25(\times100\%)=32\%Question 2: 100 people recorded their time taken to solve a puzzle. The results of this are given in the grouped frequency table below.
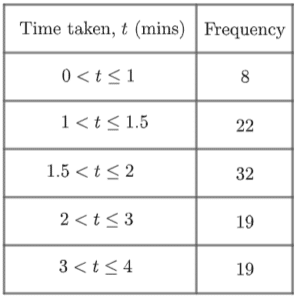
a) State how many people who took more than two minutes to complete the puzzle.
b) Find the proportion of people who completed the puzzle in 90\text{ s} or less. Give your answer as a fraction in its simplest form.
[2 marks]
a) The classes 2<t\leq3 and 3<t\leq4 are the classes of people who took longer than 2 minutes.
Hence, 19+19=38 people took longer than 2 minutes.
b) 90\text{ s} is 1.5\text{ mins}, so this is the top two classes: 0<t\leq1 and 1<t\leq1.5.
Hence, the number of people who completed the puzzle in 90\text{ s} or less is 8+22=30.
30\div100=\dfrac{3}{10}Question 3: For multiple weeks, Adam records how long it takes him to get to school.
The results are shown in the table below.
Find an estimate of the mean time Adam took to walk to school.
[4 marks]
Step 1: Add two new columns to the table, one called midpoint and one called midpoint \times frequency.
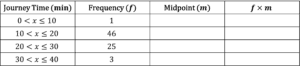
Step 2: In the midpoint column, add the midpoint of each class.
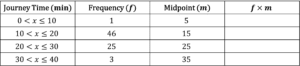
Step 3: To calculate the values for the midpoint \times frequency column, find the product of the frequency and midpoint for each row.
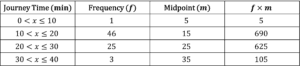
Step 4: Find the totals of the frequency column, and the midpoint \times frequency column.
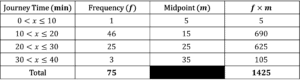
Step 5: The estimate for the mean is the total of the midpoint \times frequency column, divided by the total of the midpoint column.
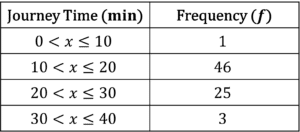
1425\div75=19\text{ min}Question 4: The table below has information on the amount of time taken by several students to get to school.
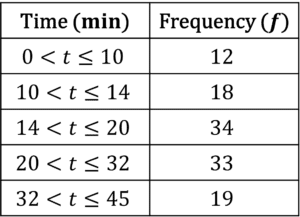
Find an estimate for the mean time taken.
Give your answer to the nearest minute.
[4 marks]
Step 1: Add two new columns to the table, one called midpoint and one called midpoint \times frequency.
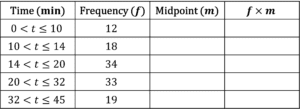
Step 2: In the midpoint column, add the midpoint of each class.
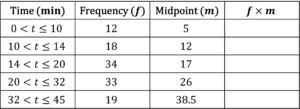
Step 3: To calculate the values for the midpoint \times frequency column, find the product of the frequency and midpoint for each row.
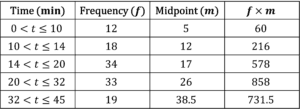
Step 4: Find the totals of the frequency column, and the midpoint \times frequency column.
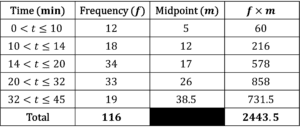
Step 5: The estimate for the mean is the total of the midpoint \times frequency column, divided by the total of the midpoint column.
2443.5\div116=21\text{ min} to the nearest minute.
Question 5: Suzanna and Rhianna organise a charity event involving throwing darts at a dartboard to see how many times participants can hit the bullseye within 10 minutes.
Suzanna compiles the table below.
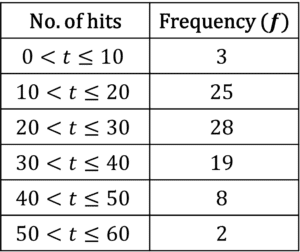
a) Find an estimate for the mean from Suzanna’s table.
Give your answer to the nearest whole number.
[4 marks]
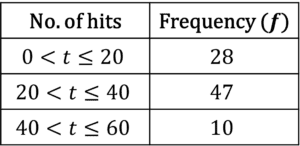
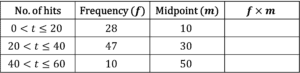
b) Rhianna compiles her data in classes of size 20 rather than 10.
Draw her grouped frequency table, then calculate the estimated mean from it.
Give your answer to the nearest whole number.
[5 marks]
a) Step 1: Add two new columns to the table, one called midpoint and one called midpoint \times frequency.
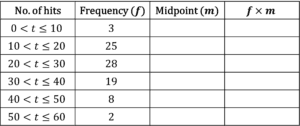
Step 2: In the midpoint column, add the midpoint of each class.
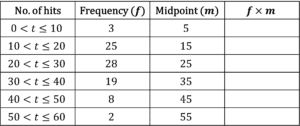
Step 3: To calculate the values for the midpoint \times frequency column, find the product of the frequency and midpoint for each row.
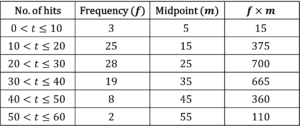
Step 4: Find the totals of the frequency column, and the midpoint \times frequency column.
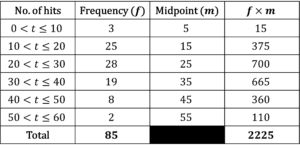
Step 5: The estimate for the mean is the total of the midpoint \times frequency column, divided by the total of the midpoint column.
2225\div85=26 hits to the nearest whole number.
b) Rhianna’s table looks like this:
Step 1: Add two new columns to the table, one called midpoint and one called midpoint \times frequency.
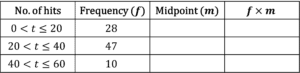
Step 2: In the midpoint column, add the midpoint of each class.
Step 3: To calculate the values for the midpoint \times frequency column, find the product of the frequency and midpoint for each row.
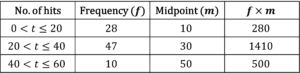
Step 4: Find the totals of the frequency column, and the midpoint \times frequency column.
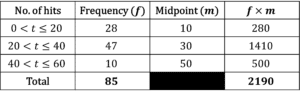
Step 5: The estimate for the mean is the total of the midpoint \times frequency column, divided by the total of the midpoint column.
2190\div85=26 hits to the nearest whole number.
You May Also Like...

MME Learning Portal
Online exams, practice questions and revision videos for every GCSE level 9-1 topic! No fees, no trial period, just totally free access to the UK’s best GCSE maths revision platform.
