Quadratic Graphs
Quadratic Graphs Revision
Quadratic Graphs
Quadratic graphs can be sketched on a set of axes, and from here the roots can be found.
Careful: In some cases, the equation may need to be rearranged to the form of a quadratic.
Sketching Quadratic Graphs and Finding the Roots

Quadratic graphs take the form
y=x^2+bx+c
They have a general U shape, with one line of symmetry halfway between the x intercepts. The x intercepts are circled in red. The y intercept is circled in blue.
Sketching:
To sketch a quadratic you can create an xy table, for a selection of x values, and plot the coordinates. Connecting these points will create the shape of your quadratic.
Roots:
To find the roots of the quadratic equation, you take a look at your sketch and see where the graph crosses the x axis.
Note: The roots of a quadratic equation are the same as the x intercepts.
Take a look at the examples below.
Example 1

Plot the following graph on a set of x and y axes,
y=x^2+2x-8
Hence, find the roots of the equation.
[3 marks]
Creating The xy Table
Substituting the values x=-5 to x=3, we get the following table:
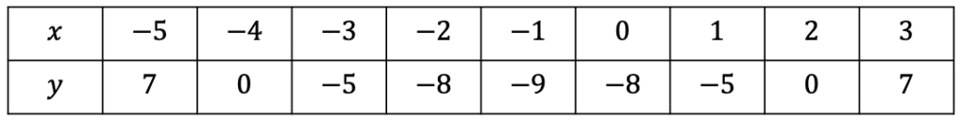
Plotting these points as coordinates we get the following graph (as seen on the right).
Finding the Roots
From the sketch we can see the graph crosses the x axis at -4 and 2. These are the roots.
Example 2

Plot the following graph on a set of x and y axes,
y=x^2+8x+15
Hence, find the roots of the equation.
[3 marks]
Creating The xy Table
Substituting the values x=-8 to x=0, we get the following table:
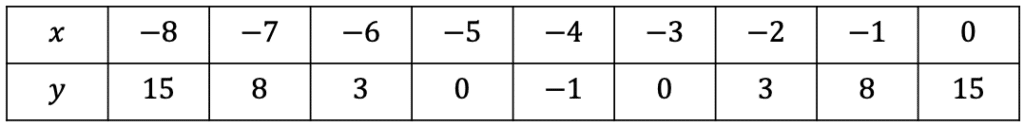
Plotting these points as coordinates we get the following graph (as seen on the right)
Finding the Roots
From the sketch we can see the graph crosses the x axis at -5 and -3. These are the roots.
Quadratic Graphs Example Questions
Question 1: On the axes below plot the the following quadratic graph, hence also find the roots.
y=x^2+7x+10
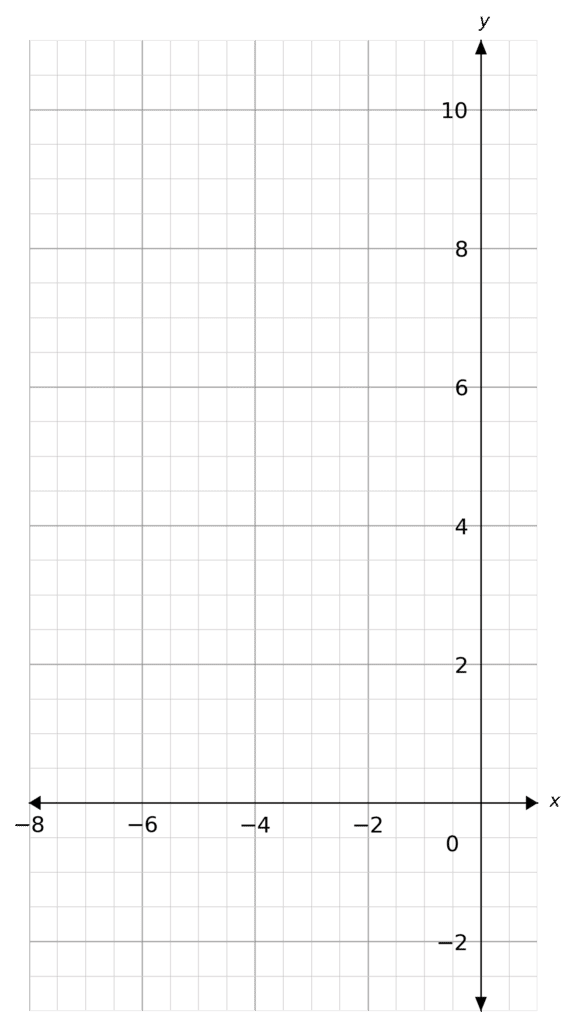
[4 marks]
y=x^2+7x+10
Creating The xy Table
Substituting the values x=-7 to x=0, we get the following table:
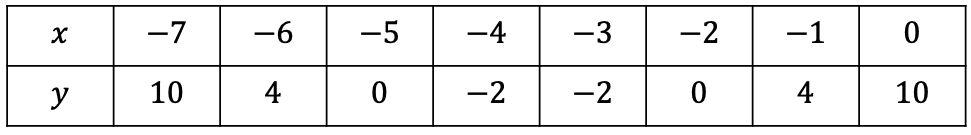
Plotting these points as coordinates we get the following graph
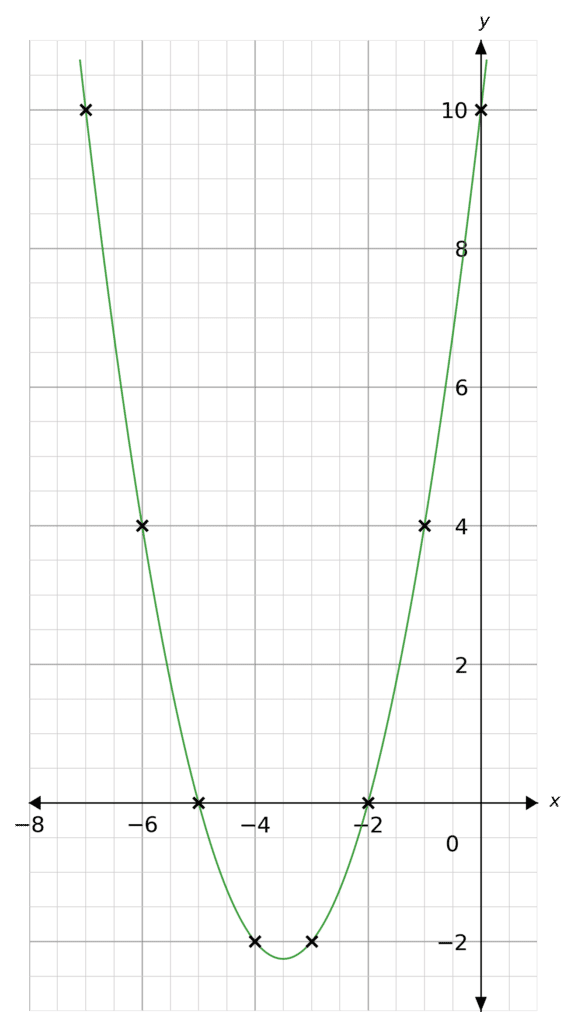
Finding the Roots
From the sketch we can see the graph crosses the x axis at -5 and -2. These are the roots.
Question 2: On the axes below plot the the following quadratic graph, hence also find the roots.
y=x^2-9x+14
[4 marks]
y=x^2-9x+14
Creating The xy Table
Substituting the values x=0 to x=9, we get the following table:
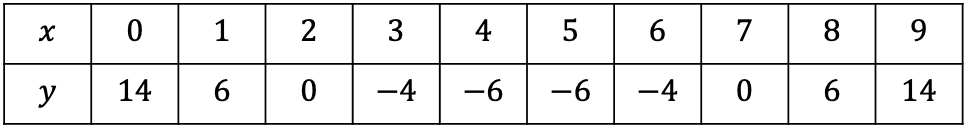
Plotting these points as coordinates we get the following graph
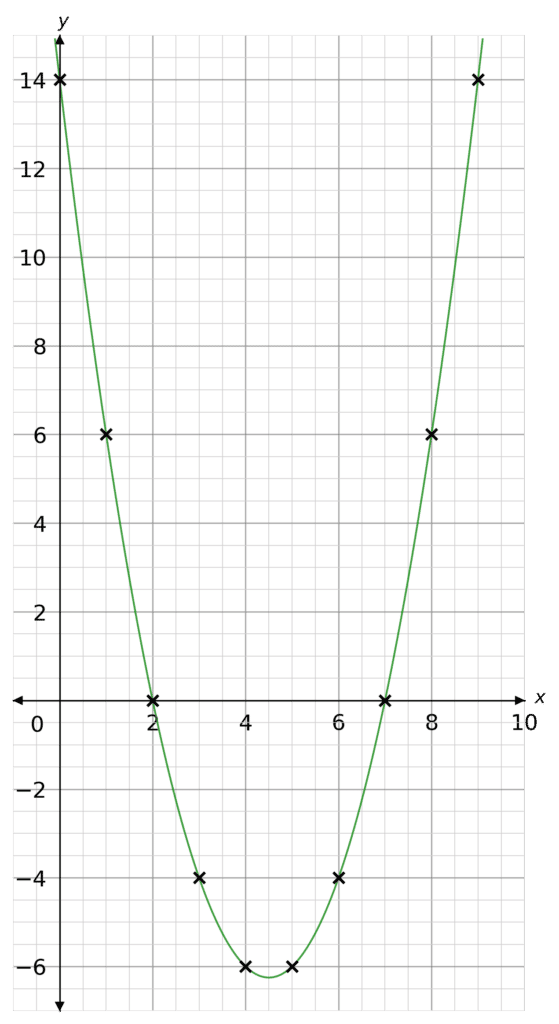
Finding the Roots
From the sketch we can see the graph crosses the x axis at 2 and 7. These are the roots.
Question 3: On the axes below plot the the following quadratic graph, hence also find the roots.
y-x^2=2x+1
[4 marks]
This question we first need to rearrange the equation to the form of a quadratic:
y=x^2+2x+1
Creating The xy Table
Substituting the values x=-8 to x=0, we get the following table:
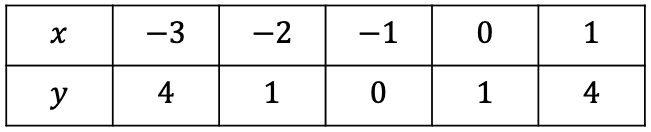
Plotting these points as coordinates we get the following graph
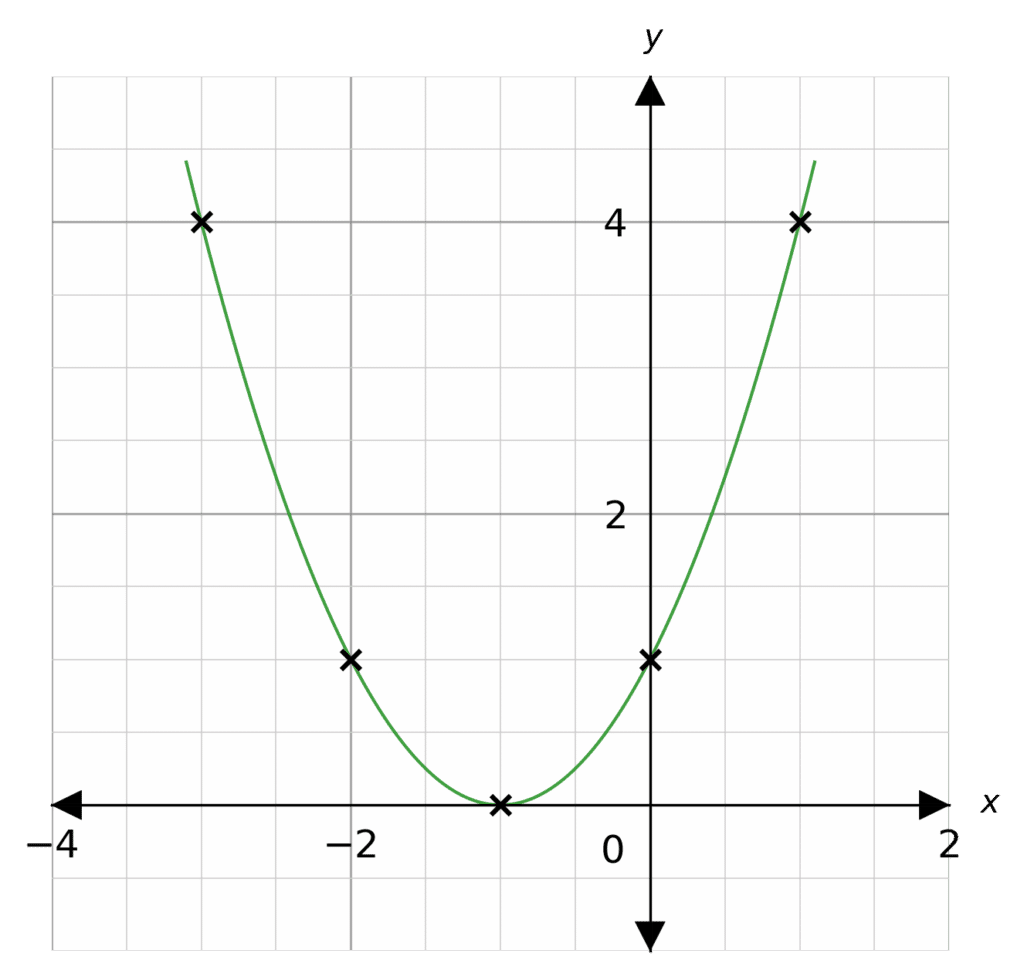
Finding the Roots
From the sketch we can see the graph touches the x axis at -1. For this particular question the quadratic equation only has one root (-1)
You May Also Like...

MME Learning Portal
Online exams, practice questions and revision videos for every GCSE level 9-1 topic! No fees, no trial period, just totally free access to the UK’s best GCSE maths revision platform.
