Quadratic, Cubic and Harder Graphs
Quadratic, Cubic and Harder Graphs Revision
Quadratic, Cubic and Harder Graphs
Graphs can take the shape of many forms; quadratic, cubic, and reciprocal. It is important you know how to identify and plot each of these types.
Quadratic Graphs – General Shape
Quadratic graphs take the form
y=\textcolor{#00d865}{a}x^2+\textcolor{#00d865}{b}x+\textcolor{#00d865}{c}
Quadratic graphs can either be positive (a>0) or negative (a<0)

Note:
- \textcolor{#00d865}{b} and \textcolor{#00d865}{c} can be zero. In this case, we have y=\textcolor{#00d865}{a}x^2
- \textcolor{#00d865}{a} can never be zero. In this case, we wouldn’t have an x^2 term and therefore the equation would not be a quadratic.
Quadratic Graphs – Plotting

To plot a quadratic graph let’s take a look at the following equation:
y=x^2+7x+10
You need to create an \textcolor{#00d865}{xy} table and plot the coordinates
Substituting the values x=-7 to x=0, we get the following table:
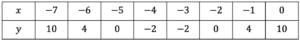
Wondering how we got the values in the table?
When x=-7 \rightarrow y=(-7)^2+7(-7)+10=10 and so on for all values of x
Plotting these points as coordinates we get the graph seen to the right.
Note: Quadratic graphs won’t always be in the form of
y=ax^2+bx+c
In this scenario, you would need to rearrange the equation. For instance:
5y-10x^2=15x+25 \rightarrow y=2x^2+3x+5
Quadratic Graphs – Finding Solutions
To find a solution to a quadratic from a graph you take a look at where the graph crosses the x axis. There are 3 cases:
- Doesn’t cross the x axis at all
- Touches the x axis once
- Crosses the x axis at two points
Here are examples of the 3 cases:

The solutions to each case are as follows:
- No solutions
- x=2
- x=-1 and x=-5
Cubic Graphs – General Shape
Cubic graphs take the form
y=\textcolor{#10a6f3}{a}x^3+\textcolor{#10a6f3}{b}x^2+\textcolor{#10a6f3}{c}x+\textcolor{#10a6f3}{d}
Cubic graphs can either be positive (a>0) or negative (a<0)
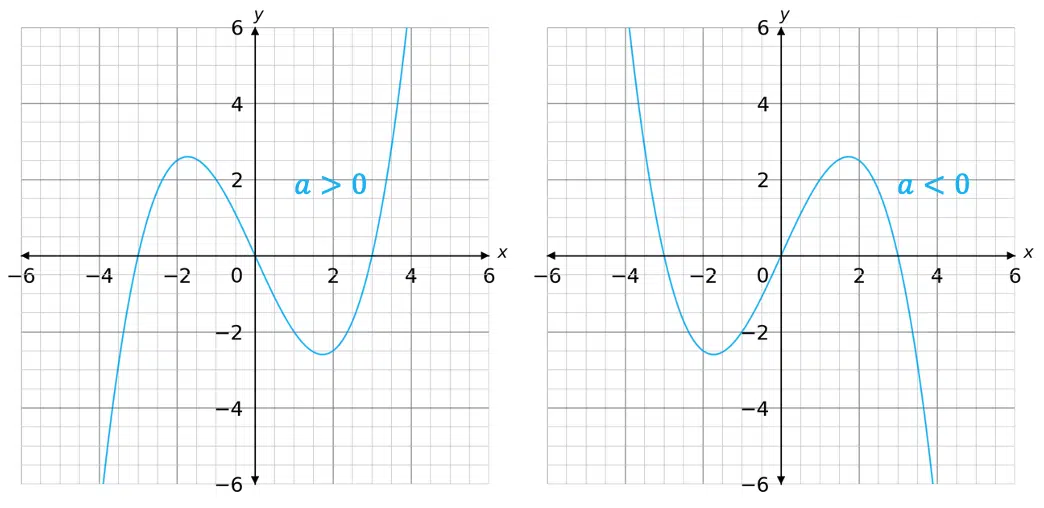
Note:
- \textcolor{#10a6f3}{b}, \textcolor{#10a6f3}{c} and \textcolor{#10a6f3}{d} can be zero. In this case, we have y=\textcolor{#10a6f3}{a}x^3
- \textcolor{#10a6f3}{a} can never be zero. In this case, we wouldn’t have an x^3 term and therefore the equation would not be a cubic.
Cubic Graphs – Plotting

To plot a cubic graph let’s take a look at the following equation:
y=x^3-3x+1
You need to create an \textcolor{#10a6f3}{xy} table and plot the coordinates
Substituting the values x=-2 to x=2, we get the following table:
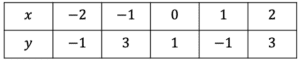
Wondering how we got the values in the table?
When x=-2 \rightarrow y=(-2)^3-3(-2)+1=-1 and so on for all values of x
Plotting these points as coordinates we get the graph seen to the right.
Note: Cubic graphs won’t always be in the form of
y=ax^3+bx^2+cx+d
In this scenario, you would need to rearrange the equation.
For instance:
\dfrac{2x^4+3x^2}{y+2}=x \rightarrow \dfrac{2x^4+3x^2}{x}=y+2 \rightarrow y=2x^3+3x-2
Cubic Graphs – Finding Solutions
To find a solution to a cubic from a graph you take a look at where the graph crosses the x axis. There are 3 cases:
- Crosses the x axis at one point
- Crosses the x axis at one point AND touches at a second point
- Crosses the x axis at three points
Here are examples of the 3 cases:

The solutions to each case are as follows:
- x=2
- x=-1 and x=1
- x=-1, x=1 and x=3
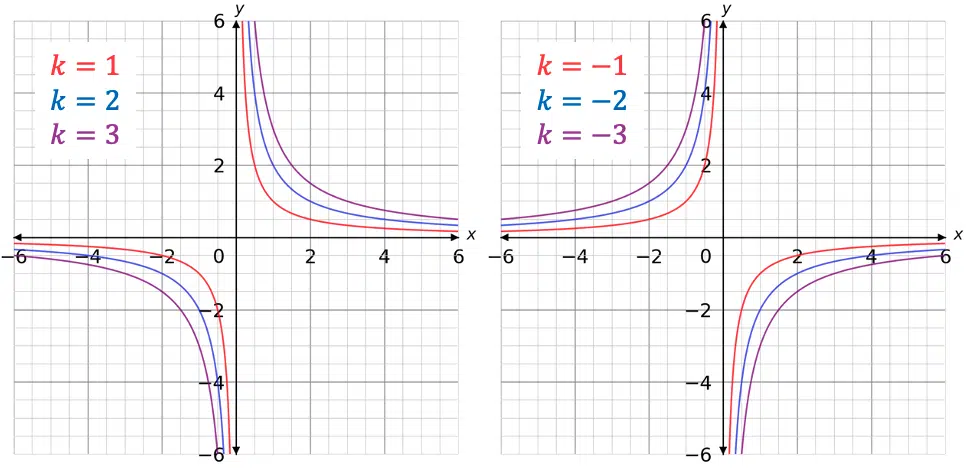
Reciprocal Graphs – General Shape (Type 1)
The first type of reciprocal graph takes the form
y=\dfrac{\textcolor{#f95d27}{k}}{x}
This type of reciprocal graph can either be positive (k>0) or negative (k<0)

Note:
- As \textcolor{#f95d27}{k} becomes larger in both directions of positive and negative, the reciprocal graphs are plotted in the same shape but further away from the origin. For instance:

Reciprocal Graphs – General Shape (Type 2)
The second type of reciprocal graph takes the form
y=\dfrac{\textcolor{#f95d27}{k}}{x^2}
This type of reciprocal graph can either be positive (k>0) or negative (k<0)

Note:
- As \textcolor{#f95d27}{k} becomes larger in both directions of positive and negative, the reciprocal graphs are plotted in the same shape but further away from the origin. For instance:
Reciprocal Graphs – Plotting (Type 1 and Type 2)

To plot a reciprocal graph let’s take a look at the following equation:
y=\dfrac{4}{x}
You need to create an \textcolor{#f95d27}{xy} table and plot the coordinates
We can chose the values used in the \textcolor{#f95d27}{xy} table, often it may be a wise choice to chose x values that produce easy to plot y values
Substituting the range of values in the table below:
Wondering how we got the values in the table?
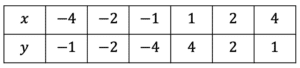
When x=-4 \rightarrow y=\dfrac{4}{-4}=-1 and so on for all values of x
Plotting these points as coordinates we get the graph seen to the right.
Note: Reciprocal graphs never cross the x axis therefore, don’t have any solutions. The same method applies to the type 2 reciprocal graphs.
Example 1: Quadratic Graphs

Plot the following equation on a set of x and y axes, then find the solutions to the quadratic.
y=x^2-9x+14 \,\,\,\,\,\,\, 1\leq x \leq 8
[4 marks]
Substituting the values x=1 to x=8, we get the following table:
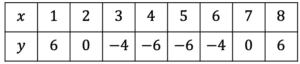
Plotting these points as coordinates we get the following graph (as seen on the right).
From the plot we can see the graph crosses the x axis at 2 and 7. These are the solutions to the quadratic.
Example 2: Cubic Graphs

Plot the following equation on a set of x and y axes, then find the solutions to the cubic.
y=x^3-2x^2+x \,\,\,\,\,\,\, -1\leq x \leq 2
[4 marks]
Substituting the values x=-1 to x=2, we get the following table:
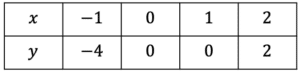
Plotting these points as coordinates we get the following graph (as seen on the right).
From the plot we can see the graph crosses the x axis at 0 and touches at 1. These are the solutions to the cubic.
Example 3: Reciprocal Graphs

Plot the following equation on a set of x and y axes,
y=\dfrac{4}{x^2}\,\,\,\,\,\,\, -4\leq x \leq 4
[4 marks]
Substituting the range of values in the table below:
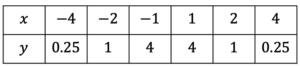
Plotting these points as coordinates we get the following graph (as seen on the right).
Quadratic, Cubic and Harder Graphs Example Questions
Question 1: Plot the following equation on a set of x and y axes, then find the solutions to the quadratic.
y=x^2+8x+15 \,\,\,\,\,\,\, -7\leq x \leq -1
[4 marks]
Substituting the values x=-7 to x=-1, we get the following table:
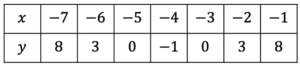
Plotting these points as coordinates we get the following graph:
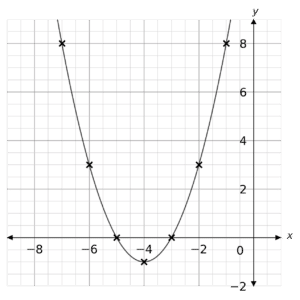
From the plot we can see the graph crosses the x axis at -5 and -3. These are the solutions to the quadratic.
Question 2: Plot the following equation on a set of x and y axes, then find the solutions to the cubic.
y=x^3-2x^2-2x-3 \,\,\,\,\,\,\, -1\leq x \leq 3
[4 marks]
Substituting the values x=-1 to x=3, we get the following table:
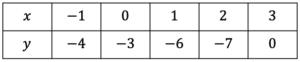
Plotting these points as coordinates we get the following graph:
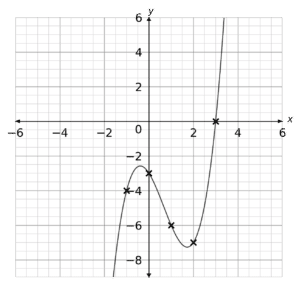
From the plot we can see the graph crosses the x axis at 3. This is the solution to the cubic.
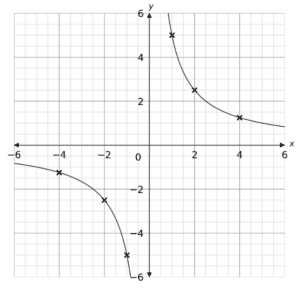
Question 3: Plot the following equation on a set of x and y axes.
y=\dfrac{5}{x}\,\,\,\,\,\,\, -4\leq x \leq 4
[3 marks]
Substituting the range of values in the table below:
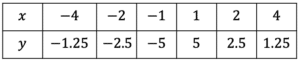
Plotting these points as coordinates we get the following graph:
You May Also Like...

MME Learning Portal
Online exams, practice questions and revision videos for every GCSE level 9-1 topic! No fees, no trial period, just totally free access to the UK’s best GCSE maths revision platform.
