Speed-Time Graphs
Speed-Time Graphs Revision
Speed-Time Graphs
Speed-time graphs (or velocity-time graphs) graph an object’s movement over time.
Time is plotted along the x-axis and is measured in a unit of time, usually seconds.
Speed is plotted along the y-axis and is usually measured in meters per second (\text{m} / \text{s} or \text{ms}^{-1})
A unique feature about speed-time graphs is how much information we can attain from them
Speed-Time Graph Basics
We may discern from a speed time graph a lot of information about the movement of the object.
The gradient of the graph is the objects acceleration.
A negative gradient means an object is decelerating.
A flat line means the object is moving with a constant speed.
The area under the curve is the distance the object has travelled.

Describing Speed-Time Graphs
We need to be able to describe the speed-time graph. One way to fully describe a speed-time graph is to break up the journey into parts.
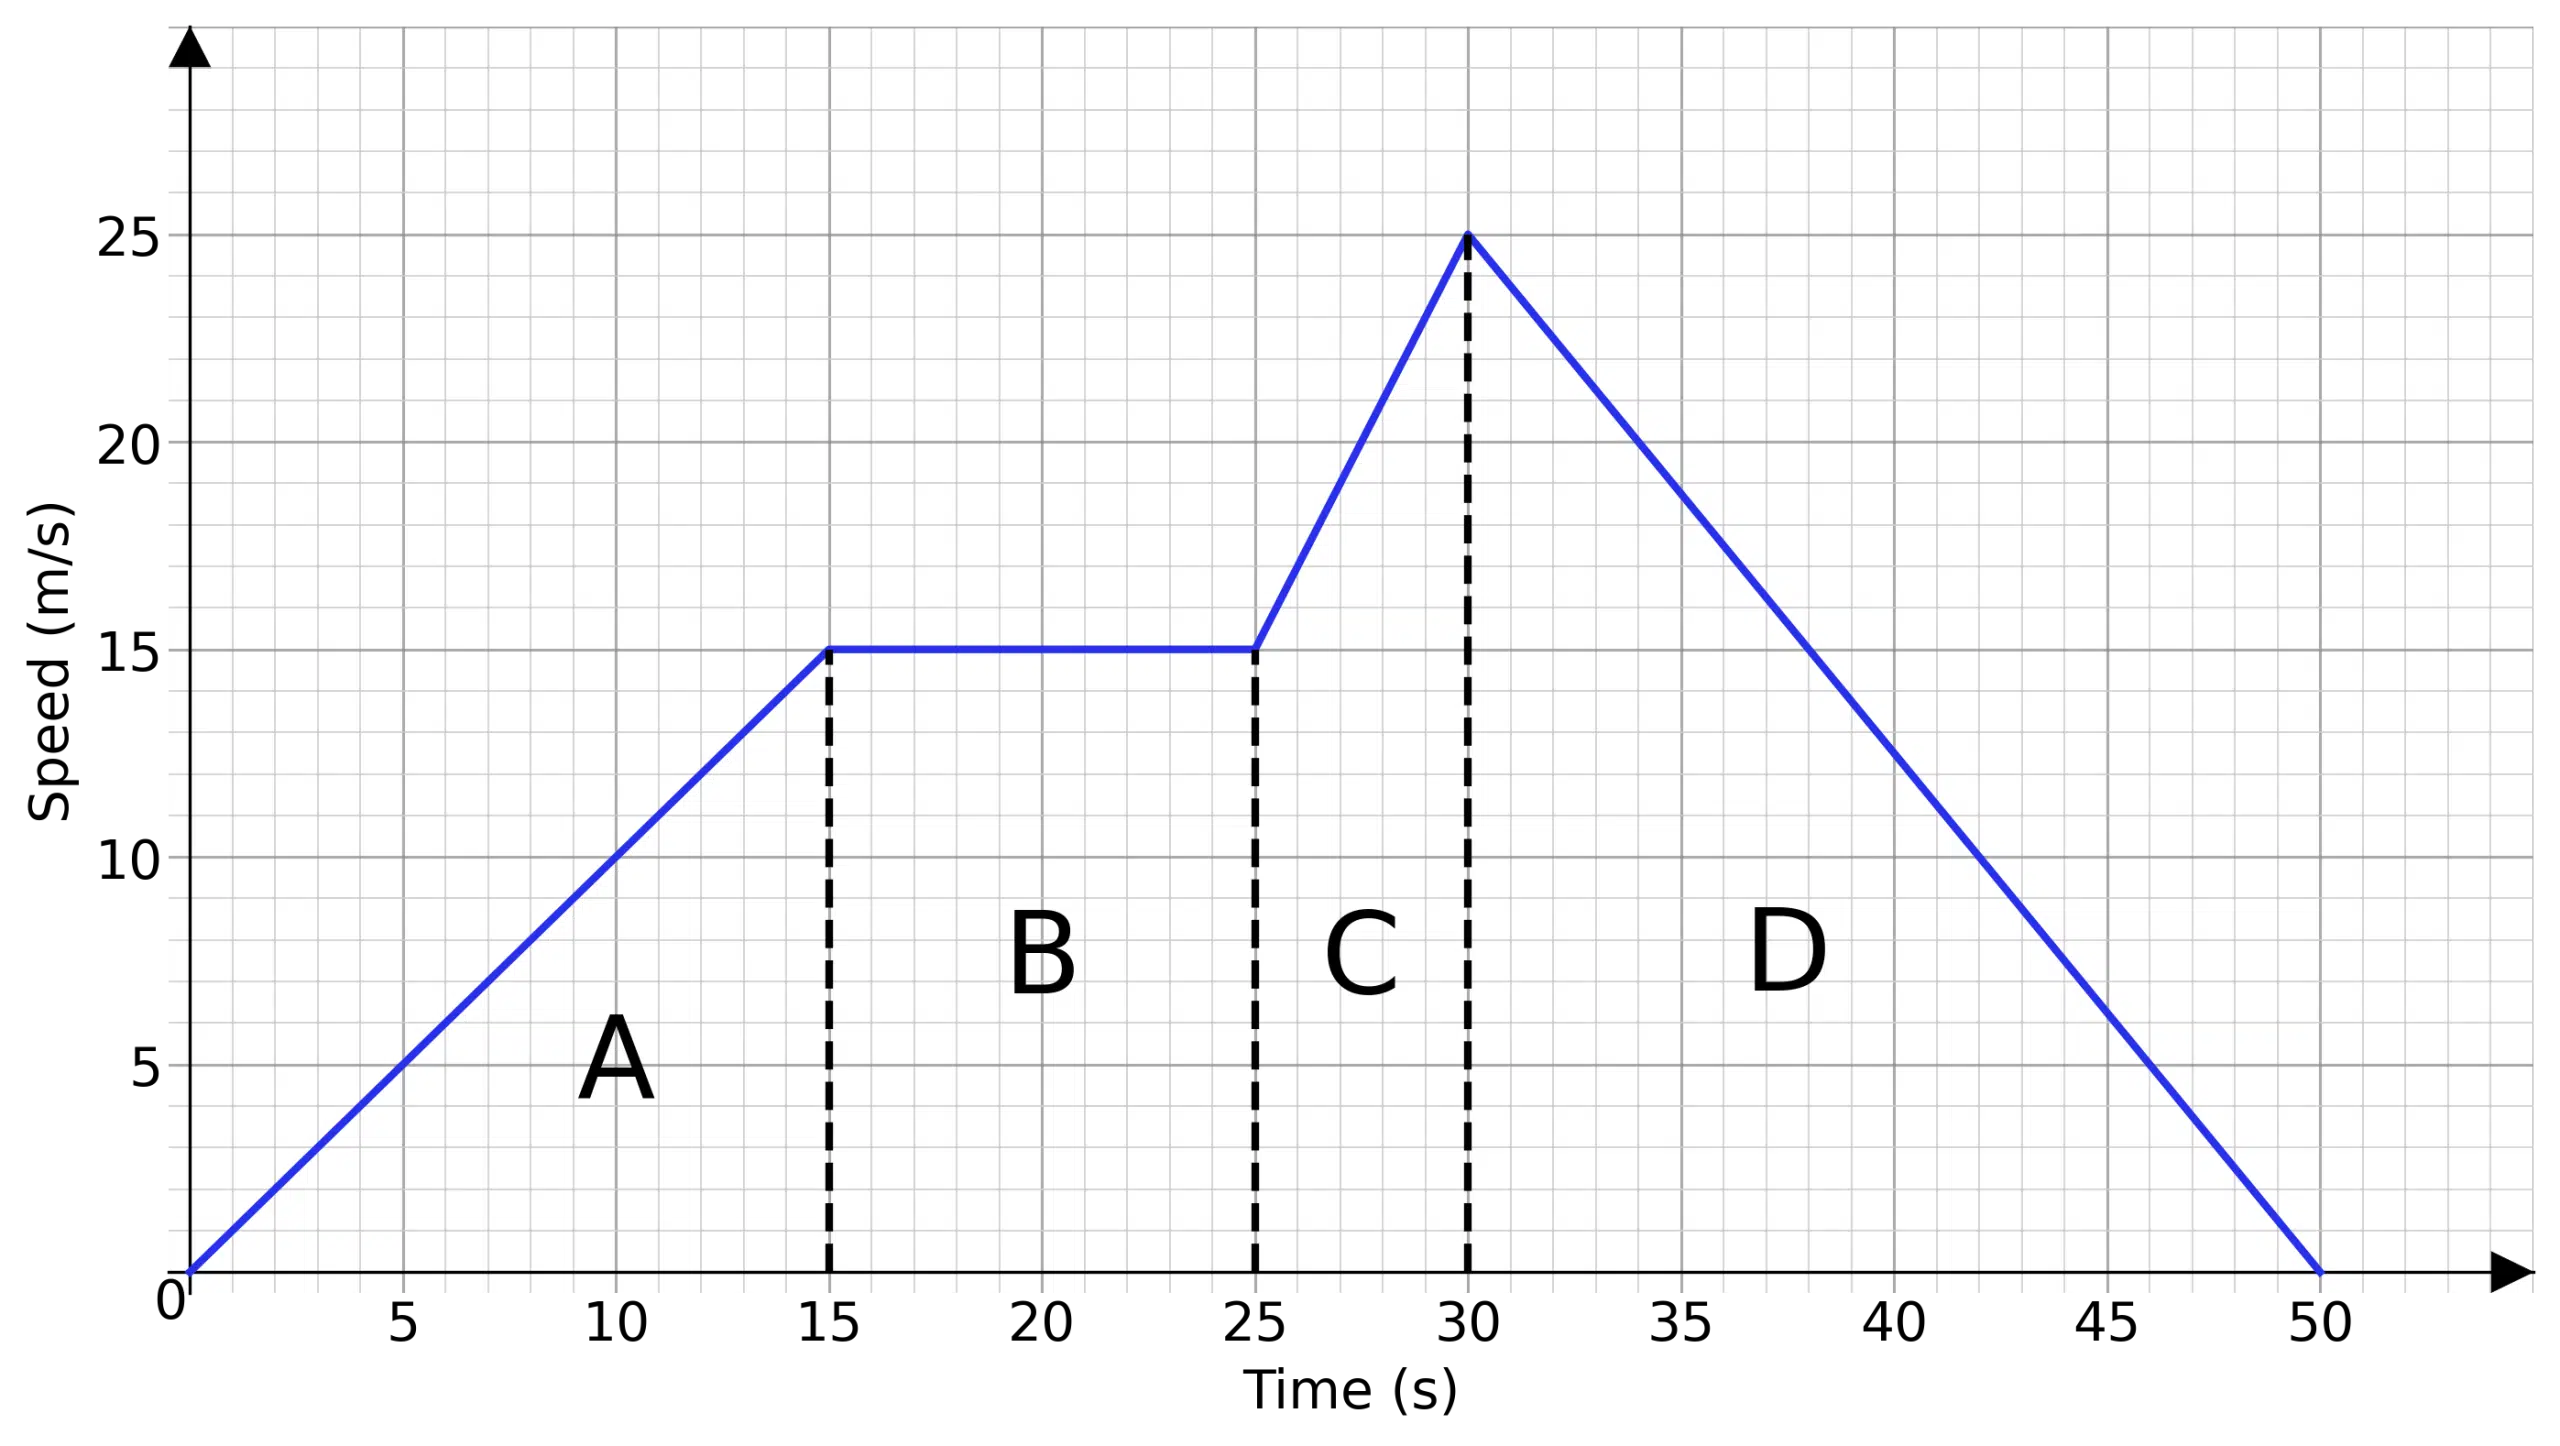
Here the graph has been broken up into four sections. A, B, C and D. Describing them individually is easier than describing the graph in one go. In this example
A: The object accelerates from 0 \text{ ms}^{-1} to 15 \text{ ms}^{-1} over 15 seconds.
B: Then the object travels at a constant speed of 15\text{ ms}^{-1} for 10 seconds.
C: The object then accelerates again from 15\text{ ms}^{-1} to 25\text{ ms}^{-1} in 5 seconds.
D: The object then decelerates from 25\text{ ms}^{-1} to stationary in 20 seconds.
Calculating Acceleration

\text{Acceleration } = \text{ The Gradient of the Line}
Using the previous example, we shall still divide the graph and find the gradient for each section.
Remember that
\text{Gradient} = \dfrac{\text{Difference in } y}{\text{Difference in } x}
given that we can find the acceleration, which is measured in meters per second^{2} or \text{ms}^{-2}.
A: The gradient is then the difference in speed divided by the difference in time, which here gives us
\text{Acceleration}= \dfrac{15-0}{15-0} = 1 \text{ ms}^{-2}
B: Here the graph is flat, so it has no acceleration.
C: The acceleration here is
\text{Acceleration}= \dfrac{25-15}{30-25} = 2\text{ ms}^{-2}
D: The acceleration here is
\text{Acceleration}= \dfrac{0-25}{50-30} = -1.25 \text{ ms}^{-2}
Negative acceleration is deceleration, so here we can say instead that it decelerates at a rate of 1.25 \text{ ms}^{-2}1.25 ms−2
Calculating Distance
\text{Distance } = \text{ Area Under the Graph}
Using the previous example, once again it makes sense to divide the graph into sections. Here the area between the line and the x-axis forms a few easier to calculate shapes.
Section A is a triangle, B a rectangle, C a trapezium and D is another triangle. We know the height and with of all these sections, so the total distance travelled is just the sum of their areas.
\textbf{Area A}= \dfrac{1}{2} \times 15 \times 15 = 112.5
\textbf{Area B}= 15 \times 10 = 150
\textbf{Area C}= \dfrac{15+25}{2} \times 5 = 100
\textbf{Area D}= \dfrac{1}{2} \times 25 \times 20 = 250
So the total distance travelled is the sum of these areas
\text{Distance Travelled} = 112.5+150+100+250
\text{Distance Travelled} = 612.5 \text{ m}
Example: Drawing a Speed-Time Graph
A car journey begins with the car stationary. It then accelerates at a constant rate to 30 \text{mph} in 10 seconds. It then travels at a constant speed for 30 seconds, then speeds up linearly to 50\text{mph} in 5 seconds only to decelerate for 20 seconds until it comes to a stop.
Draw this speed-time graph.
[4 marks]
We shall break this journey up into four sections.
Firstly, the car starts at 0 \text{ mph} at 0 seconds, then the car accelerates for 10 seconds until it is at 30 \text{mph}, so there is straight line from (0,0) to (10, 30).
Next, the car travels at a constant speed of 30\text{mph} for 30 seconds, which gives us a flat line from (10,30) to (40, 30).
Then the car accelerates for 5 seconds until it is at 50 \text{mph}. For this we draw a straight line from (40,30) to (45,50).
Finally the car decelerates for 20 seconds until it is stationary. We then draw a line from (45,50) to (65, 0)
This gives us a speed-time graph of

Speed-Time Graphs Example Questions
Question 1: For the following speed-time graph
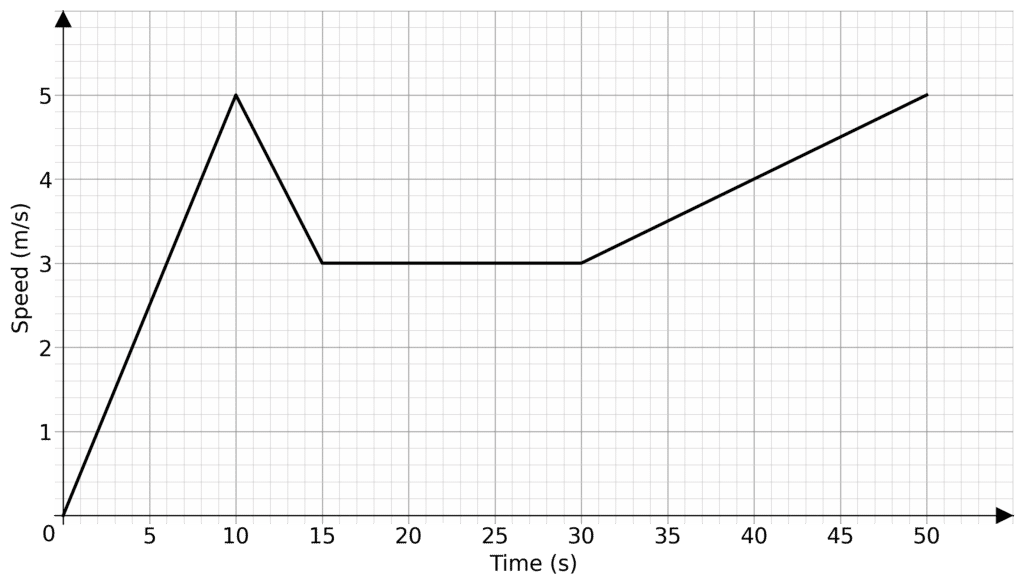
calculate
a) The total distance travelled
[3 marks]
b) The acceleration between 0 and 10 seconds
[2 marks]
a) The total distance travelled is the area under the graph. It will then be easier to break the graph into sections with easy to work out sections.
Here, sections A is a triangle, B and D are trapeziums and C is a rectangle.
\text{Area }A = \dfrac{1}{2}\times 10 \times 5 = 25\text{Area }B = \dfrac{5+3}{2}\times 5 = 20
\text{Area }C = 15 \times 3 = 45
\text{Area }D = \dfrac{3+5}{2}\times 20 = 80
So the total area is
\text{Total Area} = 25+20+45+80=170
So the distance travelled is 170 \text{ m}
b) The acceleration is the gradient. Between 0 and 10 seconds it has a constant constant gradient as it is a straight line. So using the points (0,0) and (10,5) we get a gradient of
\text{Gradient} = \dfrac{5-0}{10-0} = 0.5
So the acceleration is 0.5 \text{ ms}^{-2}
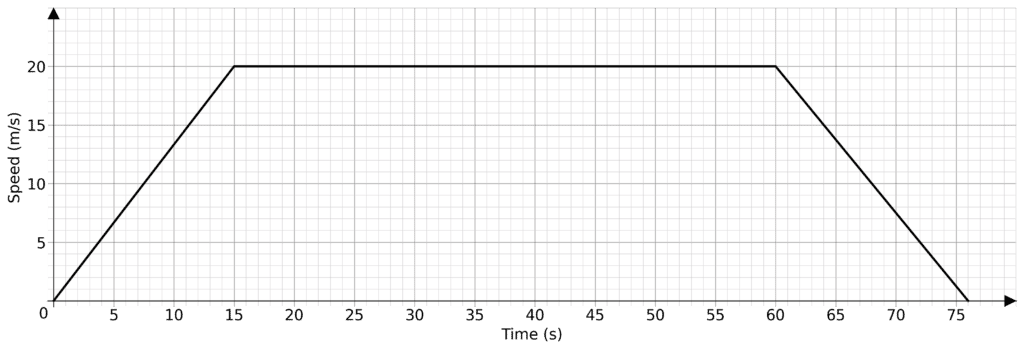
Question 2: A metro train has a short journey. As it departs from the station and accelerates at a constant rate for 15 seconds until is reaches a speed of 20 \text{ m/s} then it travels at a constant speed for 45 seconds. It then decelerates at a rate of 1.25 \text{ ms}^{-2} until it comes to a halt.
Draw a speed-time graph for the train’s journey.
[4 marks]
We begin the journey at 0 seconds and 0 \text{ m/s}. We can then draw a straight line from (0,0) to (15, 20) as the train accelerates. Then we may draw a flat line from (15,20) to (60, 20) as the train travels at a constant speed.
We need to work out how long the train takes to come to a stop. If it was increasing in speed at 1.25 \text{ ms}^{-2} to 20\text{ m/s} we would have
1.25 t = 20
t = \dfrac{20}{1.25} = 16 \text{ s}
Therefor it would take 16 seconds for the train to decelerate from 20\text{ m/s} to 0\text{ m/s} at the same rate.
So we may draw a straight line from (60, 20) to (76, 0), giving us a graph
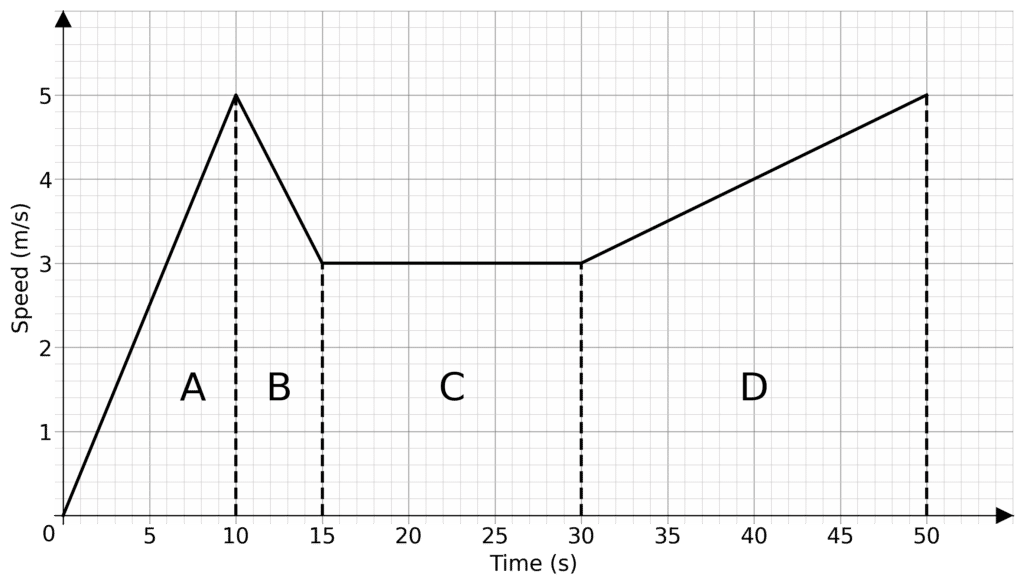
Question 3: A journey is broken up into four sections as shown
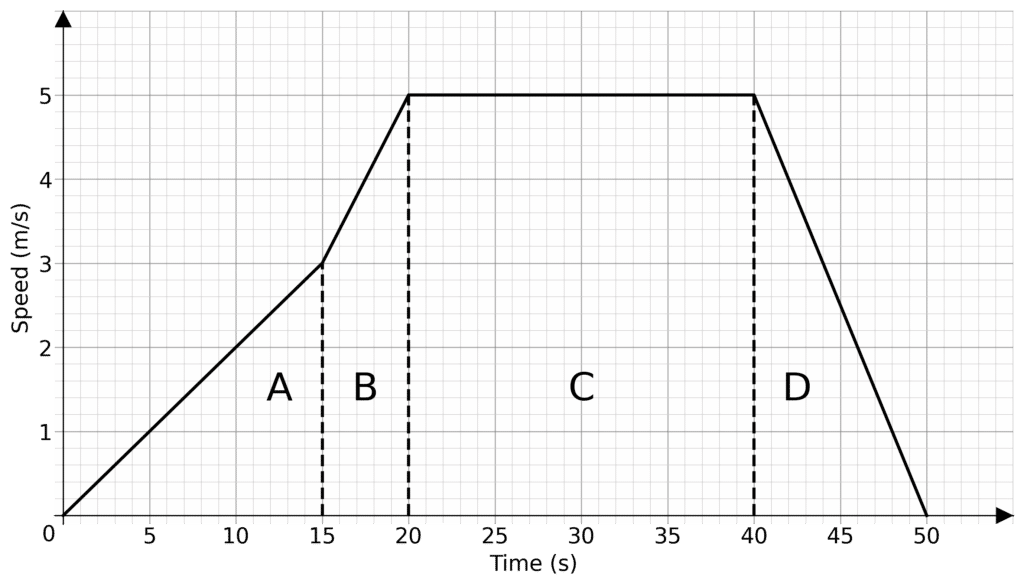
a) Describe the acceleration for each section of the journey.
[3 marks]
b) Find the total distance travelled.
[3 marks]
a) For section A: The acceleration is the gradient. Given points (0,0) and (15, 3)
\text{Gradient} = \dfrac{3-0}{15-0} = 0.2
Acceleration is 0.2 \text{ ms}^2
For section B: The acceleration is the gradient. Given points (15,3) and (20, 5)
\text{Gradient} = \dfrac{5-3}{20-15} = 0.4
Acceleration is 0.4 \text{ ms}^2
For section C: As this is a flat line the acceleration is 0 \text{ ms}^2
For section D: The acceleration is the gradient. Given points (40,5) and (50, 0)
\text{Gradient} = \dfrac{0-5}{50-40} = -0.5
The deceleration is 0.5 \text{ ms}^2
b) The total distance travelled is the area under the graph.
\text{Area }A = \dfrac{1}{2}\times 15 \times 2 = 22.5
\text{Area }B = \dfrac{5+3}{2}\times 5 = 20
\text{Area }C = 20 \times 5 = 100
\text{Area }D = \dfrac{1}{2}\times 5 \times 10 = 25
So the total area is
\text{Total Area} = 22.5+20+100+25= 167.5
So the distance travelled is 167.5 \text{ m}
You May Also Like...

MME Learning Portal
Online exams, practice questions and revision videos for every GCSE level 9-1 topic! No fees, no trial period, just totally free access to the UK’s best GCSE maths revision platform.
