Tree Diagrams
Tree Diagrams Revision
Tree Diagrams
Tree diagrams are used to display probabilities, and describe how likely it is that events will happen.
Introduction: Combined Probability
Combined probability means there are two or more events occurring.
For two events, these can be split into two SEPARATE events, and then a rule can be applied to work out the overall probability:
- The AND rule
- The OR rule
Events may be independent – the outcome of one does not affect the outcome of another; or dependent – the outcome of one does affect the outcome of another.
The AND Rule
Where event one and event two are independent events, the AND rule means both event one AND event two occur. Let’s call event one A and event two B.
The probability of Event A and Event B both happening is the same as the probability of Event A happening multiplied by the probability of Event B happening, or:
\text{P}(A \text{ and } B) = \text{P}(A)\times\text{P}(B)
Example:
If the probability of rain is 0.7 and the probability of thunder is 0.2, what is the probability of rain AND thunder?
Call probability of rain, \text{P}(R) = 0.7, and thunder, \text{P}(T)=0.2
Use the AND equation:
0.7\times0.2=0.14
So, the probability of rain AND thunder is 0.14
The OR Rule
The OR rule means either Event A OR Event B occur, where both Events are mutually exclusive (this means, the events cannot happen at the same time)
The probability of Event A OR Event B happening is the same as the probability of Event A happening added to the probability of Event B happening, or:
\text{P}(A \text{ and } B) = \text{P}(A)+\text{P}(B)
Example:
A biased dice is thrown with the probabilities given below,

Calculate the probability of a 4 or a 6 being rolled.
Use the OR equation:
0.31+0.16=0.47
So, the probability of rolling a 4 OR a 6 is 0.47
Tree Diagrams – Independent Events
Firstly, let’s look at how to construct and understand tree diagrams where the events are independent.
For example, a bag contains 3 red counters and 7 blue counters.
Lauren picks 2 counters at random. After she picks the first, she puts it back in the bag and then randomly takes the next. This means these events are independent, as the probabilities will be the same the second time she chooses a counter.

To construct a tree diagram, we need to consider probabilities. With total 10 counters in the bag,
\text{P}(R)=\dfrac{3}{10}\\
\text{P}(B)=\dfrac{7}{10}\\
These probabilities remain the same for the second selection as Lauren puts the ball back in the bag, so the tree diagram would look like this:
Using the AND rule:
Example: Find the probability that Lauren chooses a red counter AND then a blue counter.
So, on the first selection on the diagram you can see that the probability of red is \dfrac{3}{10}
Then, we can follow this red line to the second selection, where we meet the options red and blue again. If Lauren gets a blue counter on her second selection, this probability is \dfrac{7}{10}.
Therefore, using the AND rule:
\text{P}(A)\times\text{P}(B)=\dfrac{3}{10}\times\dfrac{7}{10}=0.21
Using the OR rule:
Example: find the probability Lauren chooses two counters of the same colour.
There are two ways Lauren could do this, she could get two red counters, or two blue counters.
To find the probability of two red counters, we need to firstly use the AND rule (as she is getting a red counter AND a red counter):
\dfrac{3}{10}\times\dfrac{3}{10}=0.09
Same for two blue:
\dfrac{7}{10}\times\dfrac{7}{10}=0.49
Now, she either gets two reds OR two blues, so let’s use the OR rule:
\text{P}(A)+\text{P}(B)=0.09+0.49=0.58
Tree Diagrams – Dependent Events
To draw tree diagrams for dependent events, you need to be more careful when putting the probabilities onto the diagram.
Let’s use the same example as earlier, but let’s say that Lauren does not replace the counters after the first selection.
Remember, the bag contains 3 red counters and 7 blue counters.
On the first selection, with all the counters in the bag, the probabilities will remain,
\text{P}(R)=\dfrac{3}{10}\\
\text{P}(B)=\dfrac{7}{10}\\
If Lauren picks a red counter on her first selection, there will only be 2 red counters left in the bag for her second selection, out of 9 possible counters, so the probabilities would be:
\text{P}(R)=\dfrac{2}{9}\\
\text{P}(B)=\dfrac{7}{9}\\
If Lauren picks a blue counter on her first selection, there will only be 6 bluecounters left in the bag for her second selection, out of 9 possible counters, so the probabilities would be:
\text{P}(R)=\dfrac{3}{9}\\
\text{P}(B)=\dfrac{6}{9}\\
And the tree diagram would be:

The AND rule and the OR rule for dependent events
Earlier, you learnt that the AND rule only work for independent events. However, tree diagrams are slightly different.
When plotting a dependent tree diagram, you take into account dependence when drawing probabilities onto the tree, and this means you can use the AND rule for any tree diagram.
Hence, you can use the AND rule for both independent and dependent tree diagrams.
For the OR rule, dependent events on a tree diagram are always mutually exclusive,
Hence, you can also use the OR rule for both independent and dependent tree diagrams.
Example 1: Using the AND rule
Lara is randomly choosing two crayons out of a crayon pot. The pot contains 11 green crayons and 9 pink crayons.
Work out the probability of neither of the crayons being pink.
[4 marks]
These events are not independent, as Lara does not replace the crayons, therefore we need to be careful when thinking of the probabilities. First selection probabilities:
\text{P}(G)=\dfrac{11}{20}\\
\text{P}(P)=\dfrac{9}{20}\\
If Lara picks a green counter first, there will only be 10 red counters left in the bag for her second selection, out of 19 possible counters, so the probabilities would be:
\text{P}(G)=\dfrac{10}{19}\\
\text{P}(P)=\dfrac{9}{19}\\
If Lara picks a pink counter first, there will only be 8 blue counters left in the bag for her second selection, out of 19 possible counters, so the probabilities would be:
\text{P}(G)=\dfrac{11}{19}\\
\text{P}(P)=\dfrac{8}{19}\\
And the tree diagram would be:

Now, back to the question. The probability that no pink crayons are chosen means Lara must choose two green crayons. Therefore, we can use the AND rule (Lara is picking one green AND then another green).
Probability of green on first selection =\dfrac{11}{20}
Probability of green on second selection = \dfrac{10}{19}
\text{P}(G\text{ and }G)=\dfrac{11}{20}\times\dfrac{10}{19}=\dfrac{11}{38}
Example 2: Using the OR Rule
Brendon and Kylie are taking maths exams. The probability than Brendon passes his maths exam is 0.2. The probability that Kyle passes her maths exam is 0.73. Work out the probability that exactly one of Brenden and Kylie pass their maths exam.
[4 marks]
These events are independent, so we do not need to work out probabilities to put onto the tree diagram.
But we need to work out the probabilities of Brenden and Kylie failing their exams (remember, probabilities add to 1):
\text{P(Brenden Fails)}=1-0.2=0.8
\text{P(Kylie Fails)}=1-0.73=0.27
We can now plot the tree with either Brenden first or Kyle first:

Now, the probability of exactly one of them passing their exam means either Brenden fails and Kylie passes, or Brenden passes and Kylie fails.
Let’s work out the probability of each using the AND rule:
\text{P}(\text{Brenden Fails AND Kylie Passes})=0.8\times0.73=0.584
\text{P}(\text{Kylie Fails AND Brenden Passes})=0.2\times0.27=0.054
So, using the OR rule, the probability of either of these ocurring is:
0.584+0.054=0.638
Tree Diagrams Example Questions
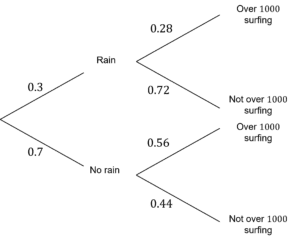
Question 1: On a beach, the chance of rain is 0.3. If it rains, the chance of there being over 1000 people surfing is 0.28 whereas if there is no rain, the probability of over 1000 people surfing is 0.56. Express this using a probability tree.
[2 marks]
Find the missing probabilities,
\text{P(Not raining)}=1-0.3=0.7
\text{P(Not over }1000\text{ surfing if raining)}=1-0.28=0.72
\text{P(Not over }1000\text{ surfing if not raining)}=1-0.56=0.44
Question 2: A biased coin is tossed twice. The probability of it landing on heads is 0.6. Use a probability tree to work out the probability of it landing on tails twice.
[4 marks]
Probability tree:
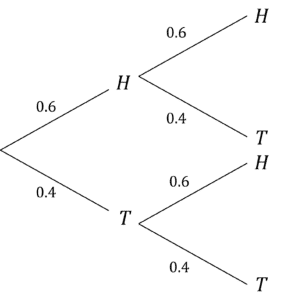
Use the AND rule to find the probability of tails twice:
\text{P(Tails and Tails)}=0.4\times0.4=0.16
Question 3: There is a lucky dip at a school fair with 100 prizes in. There are 43 rubber balls and 57 lollipops in the lucky dip. Each person gets two goes to pick out a prize at the lucky dip. Find the probability that the first person who chooses will get two of the same prizes.
[5 marks]
Let’s express this as a tree diagram, remembering that the prize will not be replaced, so the second probabilities will be different:
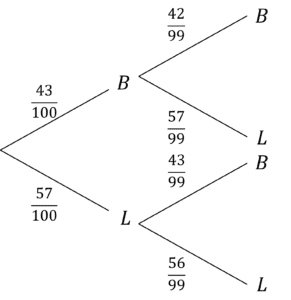
Firstly, work out the probability of two balls being picked:
\dfrac{43}{100}\times\dfrac{42}{99}=\dfrac{301}{1650}
Probability of two lollypops being picked:
\dfrac{57}{100}\times\dfrac{56}{99}=\dfrac{266}{825}
Using OR rule, probability of the same prize:
\dfrac{301}{1650}+\dfrac{266}{825}=\dfrac{833}{1650}
You May Also Like...

MME Learning Portal
Online exams, practice questions and revision videos for every GCSE level 9-1 topic! No fees, no trial period, just totally free access to the UK’s best GCSE maths revision platform.
