Revise
Estimating the Mean
Estimating the Mean Revision
Estimating The Mean
When we’re dealing with information displayed in a grouped frequency table, it’s impossible for us to calculate the actual mean because we don’t know each of the individual values. So, instead, we try our best to estimate the mean.
How to Estimate the Mean
The method for estimating the mean can be outlined as follows:
Step 1. Add a new column to the table writing down the midpoint (middle value) of each group.
Step 2. Multiply each midpoint by the frequency of that group and add the results in a new column..
Step 3. Add the values in the midpoint \textcolor{red}\times frequency column.
Step 4. Divide that value by the total frequency to get the estimate of the mean.
Remember, it is just an estimate. The actual mean could be noticeably different.
Example 1: Estimating the Mean

Cindy asked a collection of people how many hours they spent playing video games in the last week. Her results are shown in the table below.
Estimate the mean number of hours spent playing video games from Cindy’s sample.
[4 marks]
Step 1: First we need to calculate the midpoint of each class.
To do this we would add together the upper and lower value of the class and divide by 2. e.g.
\dfrac{16+20}{2} = \dfrac{36}{2} = 18
Step 2: Now we multiply the frequency by the midpoint for each row. It’s helpful to write the result in a new column.

Step 3: We now sum the frequency column, to get the total number of people asked, and get:
12 + 18 + 19 + 6 + 2 = \textcolor{red}{57}
and sum the f \times m column, and get
24 + 108 + 190 + 84 + 36 = \textcolor{red}{442}
Step 4: Now we have all of these values, we can estimate the mean by dividing the sum of f \times m by the total number of people Cindy asked:
\text{estimated mean} = \dfrac{\textcolor{red}{442}}{\textcolor{red}{57}}
Putting this (carefully) into a calculator, we get our answer:
\text{estimated mean }=\textcolor{red}{7.75\text{ hours}}


Example 2: Estimating the Mean
The grouped frequency table shows data on the weights of 117 cats. Calculate an estimate for the mean weight of the cats.
[4 marks]
As before, we need to note down the midpoints of each group.
We do this by adding the maximum and minimum in each class and dividing the result by 2.
Doing this for the last group we find,
\dfrac{4.5 + 6}{2}= \dfrac{10.5}{2} = 5.25
We then multiply each midpoint by it’s frequency and add them all together and divide by the total frequency.

The total number of cats is \textcolor{red}{117}, and the sum of the f\times m column is
55 + 45.5 + 146.25 + 123.25 + 68.25 = \textcolor{red}{438.25}
Therefore, we calculate the estimated mean to be,
\dfrac{\textcolor{red}{438.25}}{\textcolor{red}{117}} = \textcolor{red}{3.7 \text{ kg}} (1dp)
Estimating the Mean Example Questions
Question 1: For several weeks, Adam makes a note of how long it takes him to get to school.
The results are shown in the table below:

To the nearest minute, find an estimate of the mean time it takes Adam to get to school.
[4 marks]
The first thing we need to do is add an additional midpoint column to our table. Since we have a range of journey times, we have to assume that all journeys are exactly in the middle of the range. This is probably not the case in reality, which is why this is an estimated mean rather than the actual mean.
The first midpoint, the point which is half-way between 0 minutes and 10 minutes, is 5 minutes. If you are unsure how to calculate a midpoint, add up the two values and divide by 2:
\dfrac{0 + 10}{2}=5
Once you have calculated all the midpoints, you should have a table that looks like the table below:

We then need to multiply the frequency of each group by its midpoint. This will give us the estimated total journey time for the number of journeys completed within each range of journey time.
2\times5\text{ minutes}= 10\text{ minutes}
45\times15\text{ minutes}= 675\text{ minutes}
25\times25\text{ minutes}= 625\text{ minutes}
3\times35\text{ minutes}= 105\text{ minutes}
We then need to add up all these new values. This will give us the estimated total journey time for all of the journeys completed.
10\text{ minutes}+675\text{ minutes}+625\text{ minutes}+105\text{ minutes} = 1415\text{ minutes}
This means that the total estimated journey time was 1415 minutes. By adding up the frequency column, we know that 75 journeys were completed (2+45+25+3=75\text{ journeys}). Since there were 75 journeys with an estimated total time of 1415 minutes, then the estimated mean can be calculated as follows:
\dfrac{1415 \text{ minutes}}{75\text{ journeys}} = 19 \text{ minutes to the nearest minute}

Question 2: Emily is overseeing a long jump competition at her school.
The results of all the students’ long jumps are compiled in the table below:

To the nearest centimetre, find an estimate of the mean distance achieved in this long jump competition.
[4 marks]
The first thing we need to do is add an additional midpoint column to our table. Since we have a range of long jump distances, we are assuming that all jumps are exactly in the middle of the range. This is probably not the case in reality, which is why this is an estimated mean rather than the actual mean.
The first midpoint, the point which is half-way between 0 cm and 50 cm, is 25 cm. If you are unsure how to calculate a midpoint, add up the two values and divide by 2:
\dfrac{0 + 50}{2}=25
Once you have calculated all the midpoints, you should have a table that looks like the table below:

We then need to multiply the frequency of each group by its midpoint. This will give us the estimated total jump length for the number of jumps completed within each range of jump length.
2\times25\text{cm}= 50\text{cm}
18\times75\text{cm}= 1,350\text{cm}
56\times125\text{cm}= 7,000\text{cm}
32\times175\text{cm}= 5,600\text{cm}
8\times225\text{cm}= 1,800\text{cm}
We then need to add up all these new values. This will give us the estimated total jump length for all of the jumps completed.
50\text{cm}+1,350\text{cm} +7,000\text{cm} +5,600\text{cm} +1,800\text{cm} =15,800\text{cm}
This means that the total estimated jump length was 15,800 cm. By adding up the frequency column, we know that 118 jumps were completed (4+18+56+32+8=118\text{ jumps}). Since there were 118 jumps with an estimated total jump length of 15,800 cm, then the estimated mean can be calculated as follows:
\dfrac{15,800 \text{cm}}{118\text{ jumps}} = 134 \text{cm to the nearest cm}
Question 3: Below is a grouped frequency table of data collected on the lengths of students’ journeys to school:

To the nearest minute, find an estimate for the mean of this data.
[4 marks]
The first thing we need to do is add an additional midpoint column to our table. Since we have a range of journey times, we are assuming that all journeys are exactly in the middle of the range. This is probably not the case in reality, which is why this is an estimated mean rather than the actual mean.
The first midpoint, the point which is half-way between 0 minutes and 10 minutes, is 5 minutes. If you are unsure how to calculate a midpoint, add up the two values and divide by 2. For example, working out the midpoint in the 32 – 45 minute range is not that easy:
\dfrac{32 + 45}{2}=38.5
Once you have calculated all the midpoints, you should have a table that looks like the table below:

We then need to multiply the frequency of each group by its midpoint. This will give us the estimated total journey time for the number of journeys completed within each range of journey time.
12\times5\text{ minutes}= 60\text{ minutes}
18\times12\text{ minutes}= 216\text{ minutes}
34\times17\text{ minutes}= 578\text{ minutes}
33\times26\text{ minutes}= 858\text{ minutes}
19\times38.5\text{ minutes}= 731.5\text{ minutes}
We then need to add up all these new values. This will give us the estimated total journey time for all of the journeys completed.
60\text{ minutes}+216\text{ minutes}+578\text{ minutes}+858\text{ minutes}+731.5\text{ minutes} = 2443.5\text{ minutes}
This means that the total estimated journey time was 2443.5 minutes. By adding up the frequency column, we know that 116 journeys were completed (12+18+34+33+19=116\text{ journeys}). Since there were 116 journeys with an estimated total time of 2443.5 minutes, then the estimated mean can be calculated as follows:
\dfrac{2443.5 \text{ minutes}}{116\text{ journeys}} = 21 \text{ minutes to the nearest minute}
Question 4: Simon and Steve went on a 2-day fishing expedition and took note of the lengths of all the fish they caught. The data is shown in the table below:
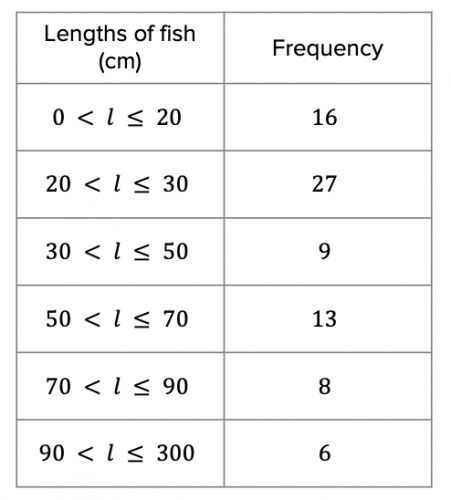
a) To the nearest cm, find an estimated mean for the data.
[4 marks]
b) What would the estimated mean be if the 6 biggest fish were not included in the data?
[2 marks]
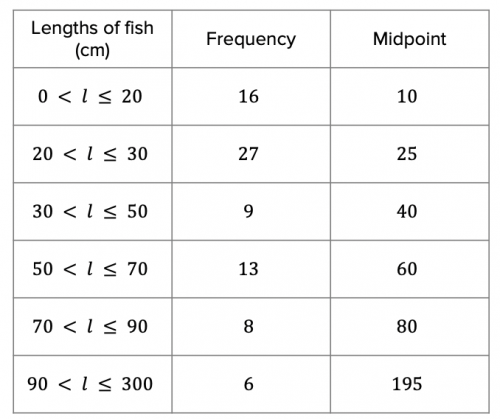
a) The first thing we need to do is add an additional midpoint column to our table. Since we have a range of fish size lengths, we are assuming that all fish caught fall exactly in the middle of the range. This is probably not the case in reality, which is why this is an estimated mean rather than the actual mean.
The first midpoint, the point which is half-way between 0 cm and 20 cm, is 10 cm. If you are unsure how to calculate a midpoint, add up the two values and divide by 2. For example, working out the midpoint in the 90 – 300 cm is not that easy:
\dfrac{90 + 300}{2}=195
Once you have calculated all the midpoints, you should have a table that looks like the table below:
We then need to multiply the frequency of each group by its midpoint. This will give us the estimated total fish length for the number of fish caught within each range of fish length.
16\times10\text{cm}= 160\text{cm}
27\times25\text{cm}= 675\text{cm}
9\times40\text{cm}= 360\text{cm}
13\times60\text{cm}= 7,800\text{cm}
8\times80\text{cm}= 640\text{cm}
6\times195\text{cm}= 1,170\text{cm}
We then need to add up all these new values. This will give us the estimated total length for all of the fish caught.
160\text{cm}+675\text{cm}+360\text{cm}+7,800\text{cm}+640\text{cm}+1,170\text{cm}=10,805\text{cm}
This means that the estimated total length of all the fish caught was 10,805cm. By adding up the frequency column, we know that 79 fish were caught (16+27+9+13+8+6=79\text{ fish caught}.) Since there were 79 fish caught with an estimated combined length of 10,805cm, then the estimated mean can be calculated as follows:
\dfrac{10,805 \text{cm}}{79\text{ fish}} = 137\text{cm to the nearest cm}
b) If we do not take into consideration the 6 fish that were in the 90 – 300 cm category, then the total number of fish caught is reduced from 79 to 73.
The estimated total length of all the 79 fish caught was 10,805cm. We need to subtract the 6 fish in the 90 – 300cm category:
10,805\text{cm} - (6 \times 196\text{cm}) = 9,629 \text{cm}
Therefore, excluding the 6 biggest fish, the estimated total length of the other 73 fish was 9,629cm. The estimated mean can therefore be calculated as follows:
\dfrac{9,629 \text{cm}}{73\text{ fish}} = 132\text{cm to the nearest cm}
Question 5: Suzanna and Flolella are organising a charity event which involves throwing darts at a board to see how many times a participant can hit the bullseye in a 10-minute period.
Suzanna compiles the data in the table below:

a) According to Suzanna, what is the estimated mean number of bullseyes hit in the 10-minute period? Give your answer to the nearest whole number.
[4 marks]
b) Flolella compiles the data differently to Suzanna by organising the data in batches of 20 hits instead of batches of 10 hits. What does Flolella’s data table look like, and how does it affect the estimated mean when she calculates it to the nearest whole number?
[3 marks]
a) The first thing we need to do is add an additional midpoint column to our table. Since we have a range of number of bullseyes hit, we are assuming that the number of bullseyes hit by each participant falls exactly in the middle of the range. This is probably not the case in reality, which is why this is an estimated mean rather than the actual mean.
The first midpoint, the point which is half-way between 0 cm and 10 cm, is 5 cm. If you are unsure how to calculate a midpoint, add up the two values and divide by 2. In this table, the midpoints are all quite easy to calculate .
Once you have calculated all the midpoints, you should have a table that looks like the table below:

We then need to multiply the frequency of each group by its midpoint. This will give us the estimated total number of bullseyes hit by participants who fall into this category.
3\times5\text{ hits}= 15\text{ hits}
25\times15\text{ hits}= 375\text{ hits}
28\times25\text{ hits}= 700\text{ hits}
19\times35\text{ hits}= 665\text{ hits}
8\times45\text{ hits}= 360\text{ hits}
2\times55\text{ hits}= 110\text{ hits}
We then need to add up all these new values. This will give us the estimated total number of times the bullseye was hit.
15\text{ hits}+375\text{ hits}+700\text{ hits}+665\text{ hits}+360\text{ hits}+110\text{ hits}=2,225\text{ hits}
This means that the estimated total number of bullseyes hit was 2,225. By adding up the frequency column, we know that there was a total of 85 participants (3+25+28+19+8+2=85\text{ participants}.) Since there were 85 participants with an estimated total of 2,225 bullseyes hit, then the estimated mean can be calculated as follows:
\dfrac{2,225 \text{ bullseyes hit}}{85\text{ participants}} = 26\text{ hits to the nearest whole number}
b) By organising the data in batches of 20 hits, rather than batches of 10 hits, each row in Flolella’s table will combine 2 of Suzanna’s rows, so the table will be half the size. It will look as follows:

In order to calculate the estimated mean, we will need to work out new midpoints, as follows:

Using Flolella’s table, the estimated mean can be calculated as follows:
\dfrac{(28\times10) + (47\times30) + (10\times 50)}{85}=26\text{ hits}
When the answer is rounded to the nearest whole number, the estimated mean is the same.
Estimating the Mean Worksheet and Example Questions
(NEW) Estimating the Mean Exam Style Questions - MME
Level 4-5GCSENewOfficial MMEEstimating the Mean Drill Questions
Averages From Frequency Tables - Drill Questions
Level 4-5GCSE
MME Premium Membership
£19.99
/monthLearn an entire GCSE course for maths, English and science on the most comprehensive online learning platform. With revision explainer videos & notes, practice questions, topic tests and full mock exams for each topic on every course, it’s easy to Learn and Revise with the MME Learning Portal.
Sign Up Now