Revise
Frequency Polygons
Frequency Polygons Revision
Frequency Polygons
Frequency polygons are a way of representing continuous, grouped data.
Drawing Frequency Polygons
To plot a frequency polygon, you must first find the midpoint of each class. This is simply the middle value within the range.
The table below shows an example of various classes, with their respective frequencies and midpoints.

The frequency polygon can now be drawn as follows:
- Draw a horizontal axis with a suitable scale that fits the midpoints of each class
- Draw a vertical axis with a suitable scale that fits the frequencies of each class
- Add a suitable title and suitable axes labels
- Plot the frequencies against the midpoints
- Connect each point to the previous one
Note: Do not connect the first point to the last point, the frequency polygon should not be closed.
Plotting the data in the previous table results in the following frequency polygon.

Interpreting Frequency Polygons
Several conclusions can be drawn from a frequency polygon.
- The modal class can be determined, this is the class with the highest frequency, evident from the highest point on the graph
- The diagram shows the estimate of the range
The estimate of the range is more useful when comparing data sets. For a single data set, we cannot determine an accurate value since we are unable to tell where the data lies within the classes.


Example 1: Drawing Frequency Polygons
A group of students ran a 100 metre race, the times achieved by the students are summarised in the table below.

Draw a frequency polygon for the group’s times.
[3 marks]
First, find the midpoints of the classes.
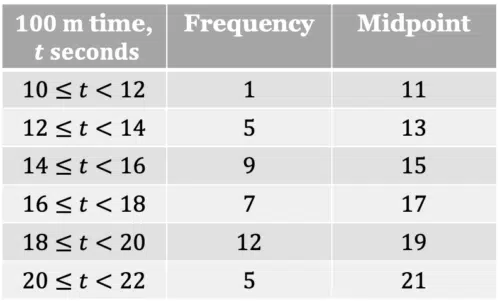
A frequency polygon can now be drawn.

The conclusions that can be drawn from this frequency diagram are:
- The modal class was 18\leq t<20, shown by the biggest peak
- The estimate for the range is 21-11=10 \text{ seconds}
Example 2: Interpreting Frequency Polygons
The following frequency polygon shows the heights of people two different classes in a school.

Compare the heights of the people in the two classes.
[3 marks]
First, find an estimate of the range of the two classes:
Class A: 210-150=60
Class B: 190-150=40
For class B, there is a point that corresponds to a height of 210 \text{ cm} however, the frequency is zero so no members of the class fall within this data class.
Therefore, Class A’s heights are more varied than Class B’s heights as the range is bigger.
We can also find each Class’s size by summing the frequencies:
Class A: 2+10+3+1=16 students in Class A
Class B: 3+9+7+0=19 students in Class B
So, Class B has more students.
We should also check where the mode lies for each Class:
Class A: The greatest frequency lies in between 160 \text{ cm} and 180 \text{ cm}, so the mode lies in the 160\leq h<180 class
Class B: The greatest frequency lies in the same interval as Class A
So the modes are the same.
Frequency Polygons Example Questions
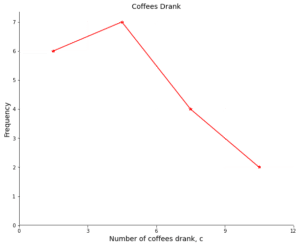
Question 1: The table below shows the number of coffees employees at an IT company drink per day.
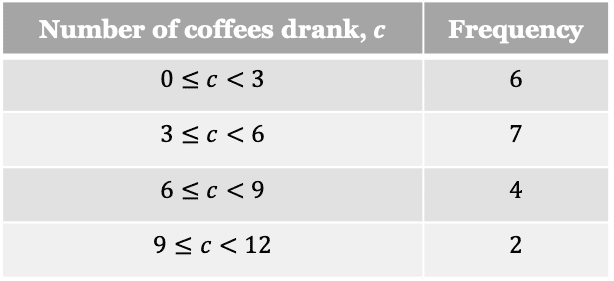
Draw a frequency polygon to represent this data.
[3 marks]
First find the midpoints:
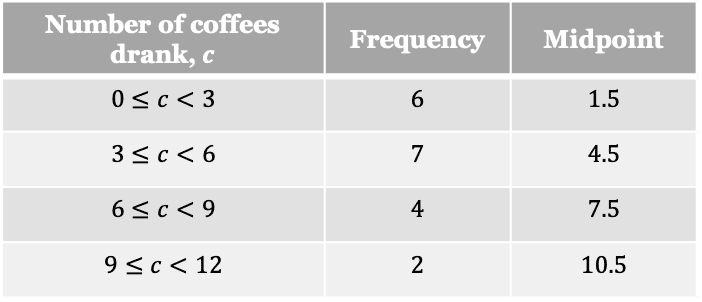
Now you can plot the midpoints against the frequency, like a scatter graph, then connect each point with a straight line:

Question 2: The frequency polygon below shows the net worth of the top 10 richest people in two different towns.
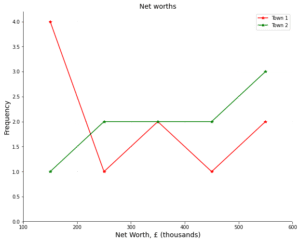
Compare the net worth of the richest people in each town.
[3 marks]
Firstly, notice how the points are distributed for each town. For Town 2 the frequencies for every class except the first is greater than or equal to the respective frequencies for Town 1. This suggests there are more people towards the higher end of wealth compared to Town 1.
The mode for Town 1 is represented by the first point, which lies in the £100000 to £200000 class. While Town 2’s mode lies in the £500000 to £600000 class. This reinforces that there are more people towards the higher end of wealth in Town 2.
The estimate of the range for each town is the same. They both have people who fall into the biggest and the smallest intervals. So, both have ranges of £550000-£150000=£400000.
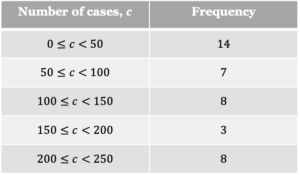
Question 3: Using the frequency polygon below, draw a grouped frequency table.
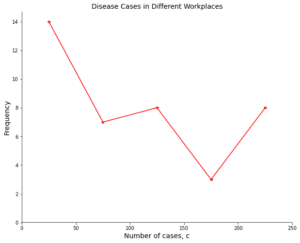
[5 marks]
First, we must determine the intervals and a title for the table.
The title for the class column can be “Number of cases, c” this is seen on the horizontal axis.
Then the intervals can be found by looking at where the points are plotted along the horizontal axis.
This results in the following table format:
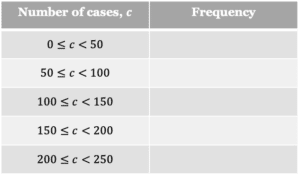
Next we must look at the relevant frequencies of each point and fill in the column, this results in the following final table: