Revise
Frequency Tables
Frequency Tables Revision
Frequency Tables
If we have collected a lot of data, we might display it in a frequency table. We need to be able to construct a frequency table and know how to interpret and use one to solve problems, such as calculating the mean, median, mode and range of the data.
Make sure you are happy with the following topics before continuing.
Tally Charts
A tally chart is a way of keeping track of the frequency of events as they happen.
To draw a tally chart, first draw a table with two columns, one for the event and one for the tallies.
Every time an event happens, put a straight, vertical line in the tally box in the row for that event.
Every fifth tally in a box should be a diagonal line through the previous 4 vertical tallies. This will create groups of 5, which will make it easier to count up in the end.
Example: Several people are voting on where they should order a takeaway from. The options are American, Chinese, Indian or Italian.
The tally chart has two columns, one for the options, and one for the tallies.
The tally chart has one row for each option.
As each person says their vote, one tally is recorded in the corresponding box.
When the fifth tally in the Indian box is drawn, it is drawn diagonally through the previous four, making it easier to count up at the end.

It can be seen from the tally chart that the most popular takeaway option is Indian, as this was chosen by 7 people.
Constructing Frequency Tables
When given a data set, it is possible to construct a frequency table in order to make the data easier to analyse. You can use tally charts, above, to keep a track of the number for each option, and then convert them into a frequency table by adding up the number of tally marks.

Example: 66 people were asked about how many bathrooms they had in their house.
30 people had 1 bathroom, 21 people had 2, 5 people had 3 and 7 people had 4 bathrooms. The rest had 5 or more.
Use this information to construct a frequency table.
We write the number of bathrooms in our left column, then frequency in the right. The only calculation that has to be done is
30+21+5+7 = 63
As the question tells us there are 66 people in total, this must mean there are 3 people who have 5 or more bathrooms. The table therefore looks like this.


Using Frequency Tables
Below is a frequency table of data based on a survey where 89 women were asked what their shoe size was.
Calculate the mean, median, and mode of the data.

Mode: Simply identify the shoe size with the highest frequency: 5.
Median: The median is the \frac{89 + 1}{2} = 45\text{th} term.
We must find the 45th term from the bottom when in order.
5 + 12 + 18 = 35, so the 35th person is the last one with size 5 feet.
5 + 12 + 18 + 19 = 54, so the 54th person is the last one with size 5.5 feet.
The 45th must therefore fall into the size 5.5 category, thus the median is 5.5.
Mean: To calculate the mean, we need to multiply shoe size by the frequency to get a new row, as shown below;

Next we add up this row to find the total shoe size.
Then we divide total shoe size by the number of people.
\text{Mean } = \dfrac{\text{Total shoe size}}{\text{Total number of women}} = \dfrac{512}{89} = 5.8 (1 dp)
Frequency Tables Example Questions
Question 1: Below is a frequency table which shows the number of bathrooms in people’s houses.
a) Find the mode and the median of the data.
b) Explain why it is not possible to find the mean of the data presented.
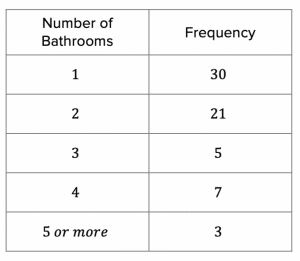
[3 marks]
a) The number of bathrooms with the highest frequency is the 1 bathroom category, so the mode is 1.
To find the median, we need to find the middle value(s). In order to find the middle value(s), we need to find how many values there are in total. The number of values in total is the sum of all the frequencies:
There are 30+21+5+7+3=66 values in total.
Since the number of values is an even number, this means that there is no single middle value, so we will need to locate the two middle values. To find the middle values we need to use the formula \dfrac{n + 1}{2} where n represents the total number of values:
\dfrac{66 + 1}{2} = 33.5
This means that the median is halfway between the 33rd and the 34th value.
If we go back to the frequency table, we can see that the first 30 values are in the 1 bathroom category, and the following 23 values are in the 2 bathroom category. Therefore values 33 and 34 are in the 2 bathroom category. Since the 33rd and the 34th values are identical, then the median is simply 2 bathrooms.
b) It is not possible to calculate the mean due to the fact that there is a category of ‘5 bathrooms or more’. We do not know exactly how many bathrooms people have who are in this category (they could have 5, they could have 500!).

Question 2: The number of goals scored by a football team in a season is shown in the table below:
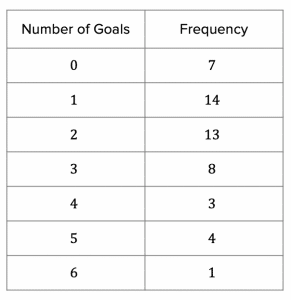
What is:
a) The mode for the number of goals scored?
b) The median number of goals scored?
c) The mean number of goals scored (to the nearest whole number)?
[4 marks]
a) Working out the mode is the easy part. Which category was the most common (has the highest frequency)?
1 goal per game is therefore the mode.
b) To find the median, we need to find the middle value(s). In order to find the middle value(s), we need to find how many values there are in total. The number of values in total is the sum of all the frequencies:
There are 7+14+13+8+3+4+1=50 values in total.
Since the number of values is an even number, this means that there is no single middle value, so we will need to locate the two middle values. To find the middle values we need to use the formula \dfrac{n + 1}{2} where n represents the total number of values:
\dfrac{50 + 1}{2} = 25.5
This means that the median is halfway between the 25th and the 26th value.
If we go back to the frequency table, we can see that the first 7 values are in the 0 goals category, and the following 14 values are in the 1 goal category. This means that the first 21 values fall in the 0 goal or the 1 goal category. The following 13 values fall into the 2 goal category, so values 25 and 26 must be in this category. Since the 25th and the 26th values are identical, then the median is simply 2 goals.
c) The mean is the total number of goals divided by the total number of games. In this question, the frequency represents the total number of games which is 50 (which we had already calculated from the previous question).
To work out the total number of goals, we need to multiply the number of goals by the frequency (if the team scored 5 goals on 4 occasions, then the team scored 20 goals in these 4 matches combined):
7\times 0 goals = 0 goals
14\times 1 goal = 14 goals
13\times 2 goals = 26 goals
8\times 3 goals = 24 goals
3\times 4 goals = 12 goals
4\times 5 goals = 20 goals
1\times 6 goals = 6 goals
Now that we know how many goals were scored in each category, we can work out the total number of goals scored:
\text{ Total number of goals scored} = 0+14+26+24+12+20+6=102
If the team scored 102 goals in 50 games, then the mean number of goals scored can be calculated as follows:
102 goals \div \, 50 games = 2 goals (to the nearest goal)
Question 3: A diving company that specialises in encounters with sharks compiles a survey and asks 240 divers how many shark encounters they had while diving with them, and compiled the data as shown below:
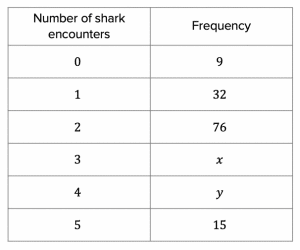
The ratio of the number of divers that had 3 shark encounters (x) to the number of divers that had 4 shark encounters (y) can be expressed as 7 : 5.
a) Find the values of x and y.
b) What is the modal number of shark encounters?
c) What is the median number of shark encounters?
d) To the nearest whole number, what is the mean number of shark encounters?
[6 marks]
a) We know that a total of 240 divers were surveyed. This means that the total of frequency column is 240. Therefore, if we subtract all the known values from 240, we can work out the value of x and y combined:
240-15-76-32-9=108 divers
Therefore
x + y = 108 divers
We have been told that the ratio of x to y is 7 : 5. This means that x is \frac{7}{12} of the total and y is \frac{5}{12} of the total. (We are dealing in twelfths here because the sum of the ratio is 12.)
We can calculate the value of x as follows:
\dfrac{7}{12}\times \, 108 divers = 63 divers
We can calculate the value of y as follows:
\dfrac{5}{12}\times 108 divers = 45 divers
b) The modal number of shark encounters is most common number of shark encounters (the category with the highest frequency). This is clearly the 2 shark encounters category since 76 divers fall into this category, more than any other.
c) To find the median, we need to find the middle value(s). In order to find the middle value(s), we need to find how many values there are in total. Since we have been told that there are 240 divers, we do not need to calculate this.
Since the number of values is an even number, this means that there is no single middle value, so we will need to locate the two middle values. To find the middle values we need to use the formula \dfrac{n + 1}{2} where n represents the total number of values:
\dfrac{240 + 1}{2} = 120.5
This means that the median is halfway between the 120th and the 121st value.
If we go back to the frequency table, we can see that the first 9 values are in the 0 shark encounters category, and the following 32 values are in the 1 shark encounter category. This means that the first 41 values fall in the 0 or the 1 shark encounter categories. The following 76 values fall into the 2 shark encounters category, so the first 117 values fall in the 0 or 1 or 2 shark encounter categories. The following 63 values fall in the 3 shark encounters category, so values 120 and 121 must be in this category. Since the 120th and the 121st values are identical, then the median is simply 3 shark encounters.
d) The mean is the total number of shark encounters divided by the total number of divers (240).
To work out the total number of shark encounters, we need to multiply the number of shark encounters by the frequency:
9\times 0 shark encounters = 0 shark encounters
32\times 1 shark encounters = 32 shark encounters
76\times 2 shark encounters = 152 shark encounters
63\times 3 shark encounters = 189 shark encounters
45\times 4 shark encounters = 180 shark encounters
15\times 5 shark encounters = 75 shark encounters
Now that we know how many shark encounters there are in each category, we can work out the total number of shark encounters:
\text{Total number of shark encounters} = 0+32+152+189+180+75=628
If 240 divers had a total of 628 shark encounters, then the mean number of shark encounters can be calculated as follows:
628 shark encounters \div \, 240 divers = 3 shark encounters (to the nearest whole number)
Mean Median Mode and Range Worksheets, Questions and Revision
Mean Median Mode and Range Worksheets, Questions and Revision
Level 4-5GCSEFrequency Tables Worksheet and Example Questions
(NEW) Frequency Tables Exam Style Questions - MME
Level 4-5GCSENewOfficial MMEFrequency Tables Drill Questions
Averages From Frequency Tables - Drill Questions
Level 4-5GCSEMME Premium Membership
£19.99
/monthLearn an entire GCSE course for maths, English and science on the most comprehensive online learning platform. With revision explainer videos & notes, practice questions, topic tests and full mock exams for each topic on every course, it’s easy to Learn and Revise with the MME Learning Portal.
Sign Up Now