Revise
Pictographs
Pictographs Revision
Pictographs
A pictograph (or pictogram) is a way of displaying data using pictures. We need to be able to draw them and interpret them. Make sure you are happy with the following topics before continuing.
Constructing a Pictograph
Pictographs are a method of displaying data. They include a key giving information on what each individual picture is worth.
Example: Faye records the number of people at football training each week for 5 weeks in the table below.
Use this information to draw a pictograph of Faye’s data, including a key.

We’re going to use footballs as the picture as it’s related to the question.
Here, we’re going to choose to have 1 football representing 20 people.
Since whole balls are worth 20 people, half a football represents 10 people and a quarter of a football represents 5 people.
For each week we match the number of people with the required number of balls, e.g. for Week 1, we have:
55=40+15=(20\times 2)+(3\times 5)
so we will draw 2 footballs and 3 quarters of a football.
The completed pictograph is:

Interpreting Pictographs
To interpret pictographs, we look at the table provided, along with the key which tells us what each individual picture is worth. We can then answer questions related to the pictograph.
Example: Riley recorded how much TV she watched from Monday to Friday one week and displayed her results using a pictograph.

How long did Riley spend watching TV on Thursday? Give your answer in hours and minutes.
Here, the key tells us that one picture of a TV is worth 30 minutes.
So, looking at Thursday, we can see that there are 3 whole TVs and 1 half TV. Therefore, the total time spent watching TV on Thursday is
(3\times 30) + 15 = 105 minutes
105 = 60 + 45 = 1 hour 45 minutes
So, the total time is 1 hour and 45 minutes.

Pictographs Example Questions
Question 1: Jenna records the number of oranges her family eats every week for four weeks. The results are shown in the table below:
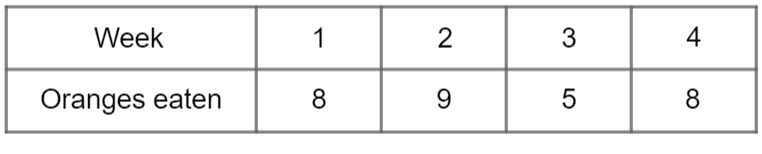
Draw a pictogram to represent this data.
[3 marks]
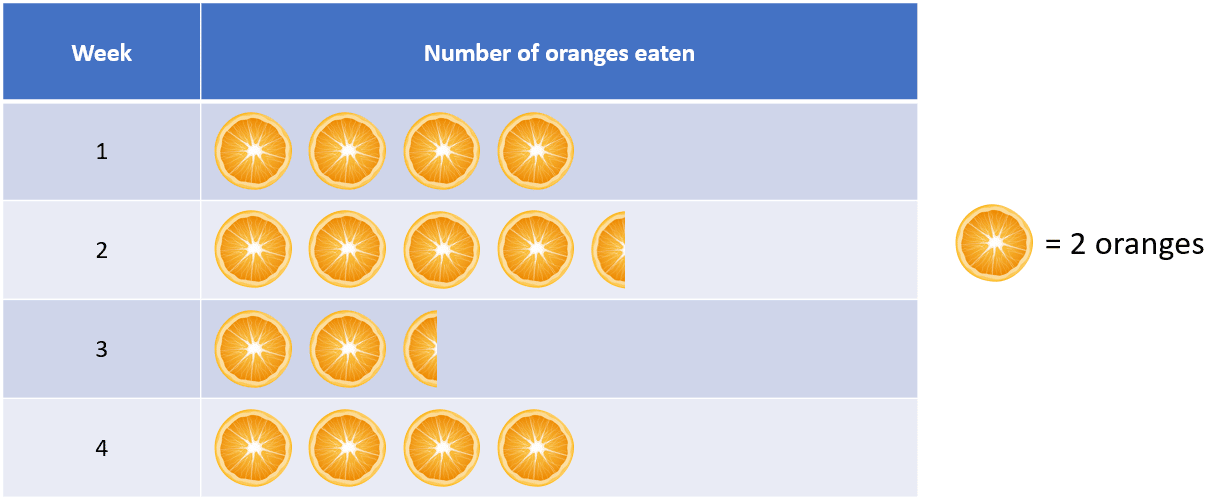
We are going to use an orange as the image for this picture (although you could use any symbol you like), so we now have to decide what our key should be. In this case, we are going to choose to make each image of an orange represent 2 oranges eaten. It is very important in your pictogram that you have a key that states that one orange image equals two oranges eaten.
(You could chose to make each image equal 1 orange, which is completely acceptable. However, it would be better to have each image represent multiple oranges in order make it easier for the person viewing the data to work out each category total.)
So, in week 1 there were 8 oranges eaten by Jenna’s family. 8\div2= 4, so we will have to draw 4 pictures for week 1.
In week 2 there were 9 oranges eaten. 9\div2 = 4.5, which means we will have to draw 4 whole oranges and one half-orange.
Continuing this process for the other two weeks, you should get a pictograph that looks like the below:

Question 2: Alexis tracked the distance she walked for 5 days. Her results are displayed in the pictograph below:
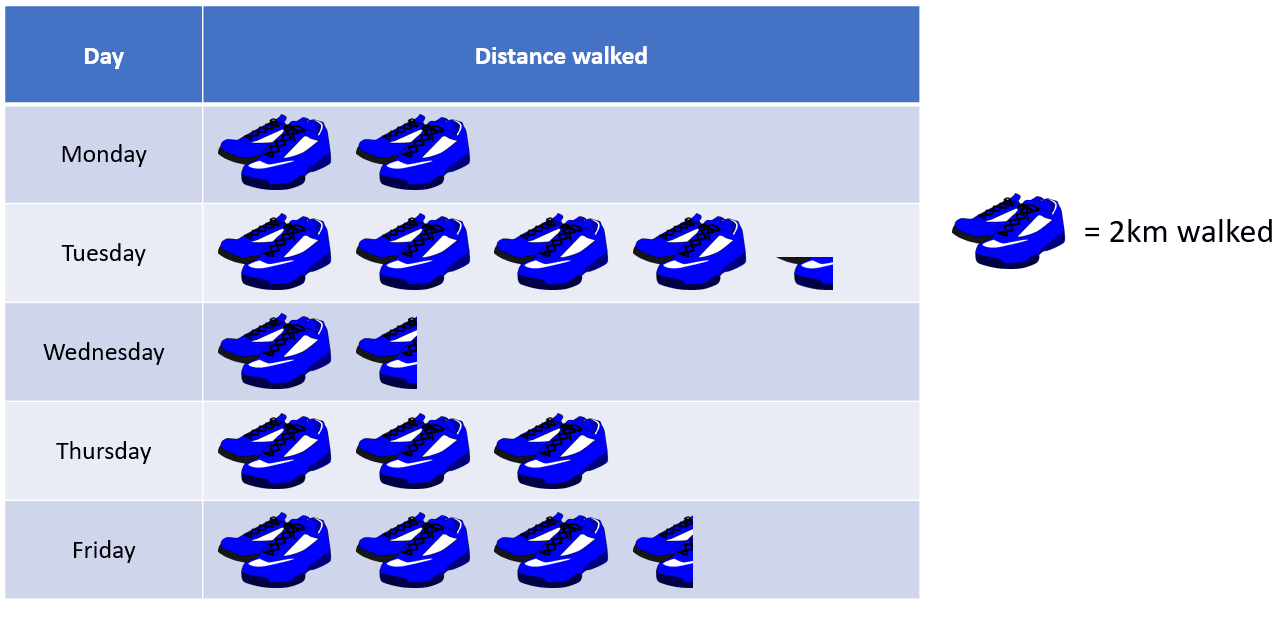
a) Work out the distance she walked on Tuesday.
b) Alexis aimed to walk at least 6km per day. On how many days did she reach this goal?
[3 marks]
a) On Tuesday there are 4 whole pictures of shoes, and one quarter of a picture.
If one picture = 2km
then
\frac{1}{4} of a picture = 2\div 4=0.5\text{ km}
So, the distance walked on Tuesday is
(4\times 2)+ 0.5=8.5\text{ km}
b) 6km is her aim. Since one picture is worth 2km, then we need to find the days where there are 3 whole sets of trainers shown.
Therefore, we can see that there are 3 days – Tuesday, Thursday, and Friday – where she achieved her goal.
Question 3: The pictogram below shows how much money was raised for charity by 6 members of a form group:
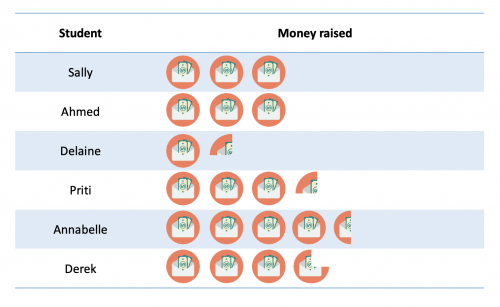
In the pictogram, each circle represents £20.
a) How many children raised more than £50?
b) What fraction of the children raised less than £60?
c) To the nearest pound, what was the mean amount of money raised?
[4 marks]
a) We have been told that each circle represents £20 raised. Therefore every semi-circle represents £10 raised and every quarter-circle represents £5 raised.
For this question, we also need to know some common decimal facts, namely that \frac{1}{2}=0.5, \frac{1}{4}=0.25 and \frac{3}{4}=0.75.
All we need to do is look at each member of the form group individually to work out how much they have raised each:
Sally: 3 circles = 3\times\pounds20=\pounds60
Ahmed: 3 circles = 3\times\pounds20=\pounds60
Delaine: 1\frac{1}{4} circles = 1.25\times\pounds20=\pounds25
Priti: 3\frac{1}{4} circles = 3.25\times\pounds20=\pounds65
Annabelle: 4\frac{1}{2} circles = 4.5\times\pounds20=\pounds90
Derek: 3\frac{3}{4} circles = 3.75\times\pounds20=\pounds75
We can therefore see that Sally, Ahmed, Priti, Annabelle and Derek raised more than £50, so 5 people raised more than £50.
b) There were just 1 student who raised less than £60 and that was Delaine (do not count Sally or Ahmed since £60 is not less than £60).
Therefore, of the 6 students, 1 of them raised less than £60, so we can write this as the following fraction:
\dfrac{1}{6}
This fraction is already in its simplest form.
c) We have already worked out how much money each individual student raised. If we add up these amounts up, we will have a combined total of money raised:
\pounds60+\pounds60+\pounds25+\pounds65+\pounds90+\pounds75 = \pounds375
Since there are 6 students, the mean amount raised will be the combined total divided by 6:
\pounds375\div6 = \pounds63\text{ to the nearest pound}
Question 4: The pictogram shows some information about the number of types of butterflies in a butterfly farm:
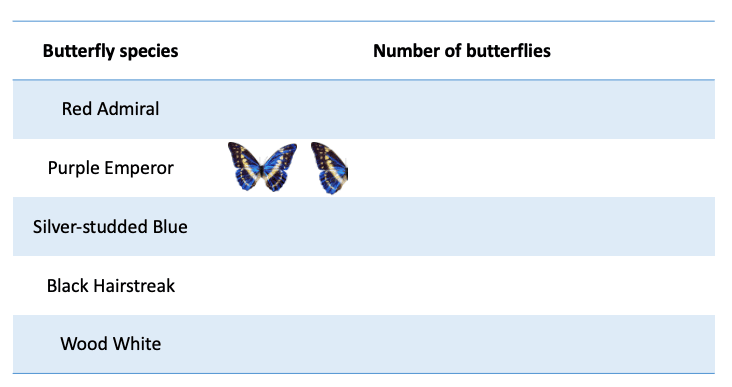
In total, there are 60 Purple Emperors.
There are 3 times as many Red Admirals as there are Purple Emperors.
The number of Silver-studded Blue butterflies is \frac{2}{3} the number of Red Admirals.
There are 100\% more Black Hairstreaks than there are Silver-studded Blues.
The number of Wood Whites is 37.5\% of the number of Black Hairstreaks.
Complete the pictograph above.
[5 marks]
The first thing we need to do in this question is to work out how many butterflies are represented by each butterfly image in the pictograph. We are told that there are 60 Purple Emperors, and this is shown with 1\frac{1}{2} butterflies.
Therefore, each butterfly image in the pictograph must represent:
1\text{ image}=60\div1.5 = 40\text{ butterflies}
We are told that there are 3 times as many Red Admirals as there are Purple Emperors. If there are 60 Purple Emperors, then there must be
3\times60 = 180 \text{ Red Admirals}
We are told that the number of Silver-studded Blue butterflies is \frac{2}{3} the number of Red Admirals. If there are 180 Red Admirals, then the number of Silver-studded Blues can be calculated as follows:
180\times\dfrac{2}{3} = 120\text { Silver-studded Blues}
We are told that there are 100\% more Black Hairstreaks than there are Silver-studded Blue butterflies. This means that the number of Black Hairstreaks is double the number of Silver-studded Blues. Since there are 120 Silver-studded Blues, then there must be
2\times120 = 240 \text{ Black Hairstreaks}
Finally, we are told that the number of Wood Whites is 37.5\% of the number of Black Hairstreaks. Since there are 240 Black Hairstreaks, then the number of Wood Whites can be calculated as follows:
240\times0.375 = 90\text{ Wood Whites}
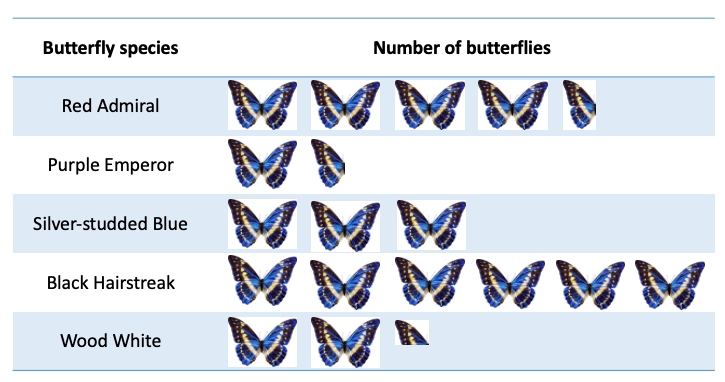
Since we know know exactly how many butterflies there are of each species, we now need to work out how many butterfly images to draw to represent each species total.
One butterfly image represents 40 butterflies, so we can calculate the number of butterfly images we need to draw for each species as follows:
Red Admiral:
180\div40=4.5\text{ butterfly images}
Silver-studded Blue:
120\div40=3\text{ butterfly images}
Black Hairstreak:
240\div40=6\text{ butterfly images}
Wood White:
90\div40=2.25\text{ butterfly images}
Therefore, your final pictograph should look like the below:
Question 5: Gary has been tracking the amount of guitar practice he does over a 4-week period.
The ratio of guitar practice he does for week 1 to week 2 is 7 : 8.
The ratio of guitar practice he does for week 2 to week 3 is 2 : 1.
The ratio of guitar practice he does for week 3 to week 4 is 2 : 3.
Gary does 24 hours of guitar practice in week 4.
Complete the below pictogram to represent the above information.
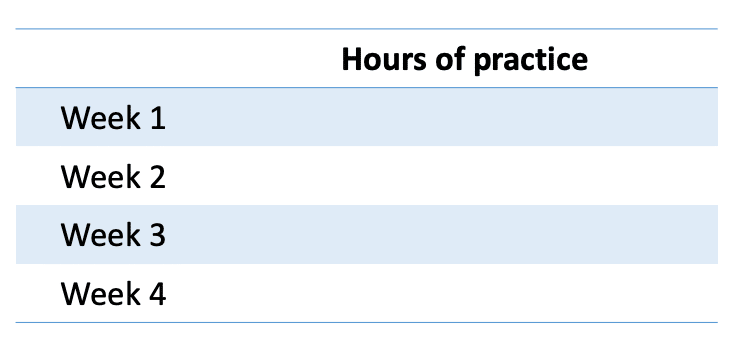
[5 marks]
The key piece of information that we have is that in week 4, Gary does 24 hours of guitar practice.
We can use this key piece of information to help us solve the statement: the ratio of guitar practice he does for week 3 to week 4 is 2 : 3. (This is the only statement we can try to work out at the moment, since the only known value we have is the week 4 value.)
If the ratio of guitar practice is 2 : 3 for week 3 to week 4, then we will need to find an equivalent ratio for x: 24 where x represents the week 3 value. Since the week 4 figure is 8 times greater than the figure given in the ratio (24\div3=8), then we will have an equivalent ratio if we also multiply the week 3 ratio figure by 8.
Since 2\times8=16, Gary therefore does 16 hours of guitar practice in week 3.
Since we now know the week 3 value, we can work out the week 2 value.
If the ratio of guitar practice is 2 : 1 for week 2 to week 3, then we will need to find an equivalent ratio for x : 16 where x is the week 2 value. Since the week 3 figure is 16 times greater than the figure given in the ratio, then we will have an equivalent ratio if we also multiply the week 2 ratio figure by 16.
Since 16\times2=32, Gary therefore does 32 hours of guitar practice in week 2.
Since we now know the week 2 value, we can work out the week 1 value.
If the ratio of guitar practice is 7 : 8 for week 1 to week 2, then we will need to find an equivalent ratio for x : 32 where x is the week 1 value. Since the week 2 figure is 4 times greater than the figure given in the ratio (32\div8=4), then we will have an equivalent ratio if we also multiply the week 1 ratio figure by 4.
Since 4\times7=28, Gary therefore does 28 hours of guitar practice in week 1.
Now that we have that total number of hours for weeks 1 to 4 (28 hours, 32 hours, 16 hours and 24 hours), we need to work out how to show this on the pictogram. Since all of the above numbers are divisible by 4, then it would be logical make your pictogram image represent 4 hours of practice.
For week 1, you would need 28\div4=7 \text{ complete images}
For week 2, you would need 32\div4=8 \text{ complete images}
For week 3, you would need 16\div4=4 \text{ complete images}
For week 4, you would need 24\div4=6 \text{ complete images}
Your final pictogram should be similar to the below:
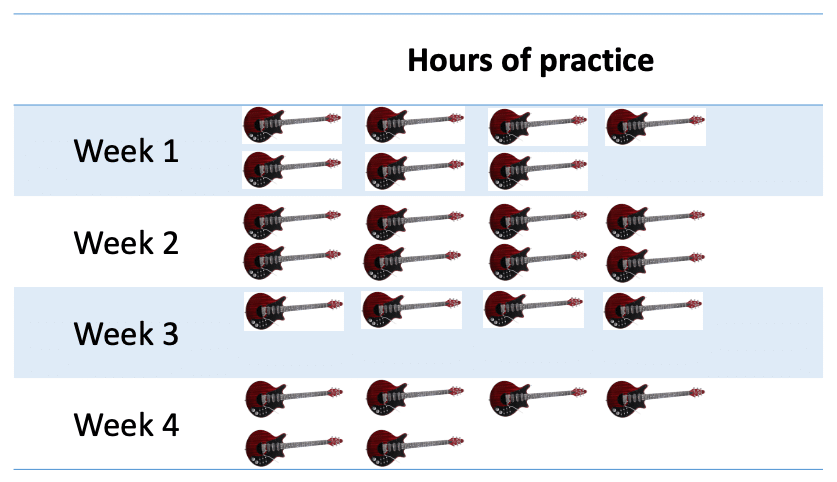
(The image doesn’t have to be a guitar; it can be anything of your choice! Keep it simple and use a circle if you like!)
Pictographs Worksheet and Example Questions
(NEW) Pictographs Exam Style Questions - MME
Level 1-3GCSENewOfficial MME
MME Premium Membership
£19.99
/monthLearn an entire GCSE course for maths, English and science on the most comprehensive online learning platform. With revision explainer videos & notes, practice questions, topic tests and full mock exams for each topic on every course, it’s easy to Learn and Revise with the MME Learning Portal.
Sign Up Now