Revise
Quadratics and Harder Graphs
Quadratics and Harder Graphs Revision
Quadratic Graphs and Other Graphs
This topic includes graphs which are not straight lines.
These include, quadratic graphs, cubic graphs, reciprocal graphs and exponential graphs.
You will need to be able to identify and plot these graphs.
You need to be happy with the following topics:
Quadratic Graphs
Quadratic graphs have the general form
\textcolor{red}{a}x^2 + \textcolor{limegreen}{b}x+\textcolor{blue}{c}
These form a \bigcup or \bigcap shape, examples are shown below:

Note: \textcolor{limegreen}{b} and \textcolor{blue}{c} can be zero, as is the case with y=x^2


Cubic Graphs
Cubic graphs have the general form
\textcolor{red}{a}x^3 + \textcolor{limegreen}{b}x^2+\textcolor{blue}{c}x +\textcolor{maroon}{d}
These form S shape in the middle.
Note: Sometimes this S can be fairly flat, e.g.
\textcolor{red}{2}x^3 + \textcolor{limegreen}{3}x^2 + \textcolor{blue}{x}
Interpreting Roots and Intercepts
The roots of a quadratic are the values of x where the quadratic equals 0, so if
y= ax^2+bx+c
then the roots of ax^2+bx+c are the values of x when y=0. When the quadratic is graphed, the roots are the points on the graph where it crosses the x-axis. These points are called the x-intercepts.
So if x_1 and x_2 are roots of the quadratic, then the point (x_1, 0) and (x_2, 0) are on the graph.

In this example, the roots of the quadratic can be interpreted graphically as the points that the curve crosses the x-axis. Giving us
(-3,0) and (3,0)
So the roots are x=3 and x = -3
The y-intercept is where the curve crosses the x-axis. In this case it is at the point
(0,-3)
So the y-intercept is y=-3
The graphical interpretation of the x and y-intercepts can also be done for other types of graphs such as cubic graphs.

Reciprocal Graphs
Reciprocal graphs have the general form
y = \dfrac{\textcolor{red}{k}}{x}
e.g.,
y = \dfrac{\textcolor{red}{1}}{x}

Exponential Graphs
Exponential graphs have the general form
y = \textcolor{blue}{k}^x
e.g.,
y = \textcolor{blue}{3}^x
Example 1: Plotting Quadratics
Plot the following quadratic equation:
y=x^2-x-5
[2 marks]
First draw a table of coordinates from x=-2 to x=3, then use the values to plot the graph between these values of x.
Step 1: Draw a table for the values of x between -2 and 3.
Step 2: Substitute our values of x into the equation to get the corresponding y values.
For example, when x=\textcolor{red}{-2}, we get
y=(\textcolor{red}{-2})^2-(\textcolor{red}{-2})-5=4+2-5= \textcolor{blue}{1}.
Step 3: Continue this process for all other values of x

Step 4: From the table we get coordinates to plot. e.g. (\textcolor{red}{-2}, \textcolor{blue}{1})
Once plotted, we join all the points with a smooth curve, giving the following graph.

Example 2: Plotting Cubics
Using the equation y=x^3-2x^2, draw a table of coordinates from x=-1 to x=3. Use the values to plot the graph between these x values.
[3 marks]
Step 1: Draw a table of the coordinates for x from -1 to 3
Step 2: Substitute our values of x into the equation to get the corresponding y values.
For example, for x=\textcolor{red}{1}, we get
y=\textcolor{red}{1}^3-2(\textcolor{red}{1})^2=\textcolor{blue}{-1}.
Step 3: Continue this process for all other values of x

Step 4: From the table we get coordinates to plot. e.g. (\textcolor{red}{1}, \textcolor{blue}{-1})
Once plotted, we join all the points with a smooth curve giving the following graph.

Example 3: Plotting Reciprocals
Using the equation y= \dfrac{1}{x} draw a table of coordinates from x = -2.5 to x=2.5. Use the values to plot the graph between these x values.
[3 marks]
Step 1: Draw a table of the coordinates for x from -2.5 to 2.5
Step 2: Substitute our values of x into the equation to get the corresponding y values.
For example, for x = -2, we get
y= \dfrac{1}{-2} =-0.5
Step 3: Continue this process for all other values of x

Step 4: From the table we get coordinates to plot. e.g. (-2, -0.5)
Once plotted, we join all the points with a smooth curve giving the following graph.

Example 4: Plotting Exponentials
Using the equation y= 2^x draw a table of coordinates from x = -1 to x=3. Use the values to plot the graph between these x values.
[3 marks]
Step 1: Draw a table of the coordinates for x from -1 to 3
Step 2: Substitute our values of x into the equation to get the corresponding y values.
For example, for x = -1, we get
y= 2^-1 =0.5
Step 3: Continue this process for all other values of x

Step 4: From the table we get coordinates to plot. e.g. (-1, 0.5)
Once plotted, we join all the points with a smooth curve giving the following graph.

Quadratics and Harder Graphs Example Questions
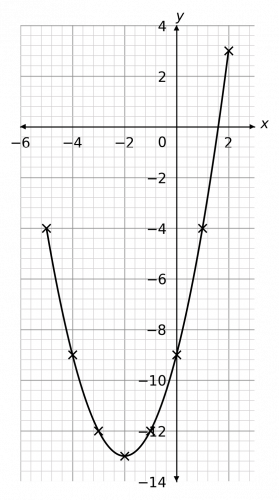
Question 1: Using the equation y=x^2+4x-9, complete the table of coordinates below. Use these coordinates to plot the graph between x=-5 and x=2.
[2 marks]

We will complete this table by substituting in the values of x to get the missing values of y. For example, when x=2,
y=(-4)^2+4(-4)-9=16-16-9=-9
Continuing this with the rest of the x values, we get the completed table below.

Then, plotting these coordinates on a pair of axes and joining them with a curve, we get the graph below.

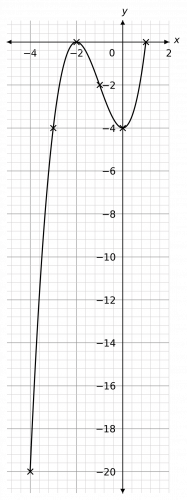
Question 2: Using the equation y=x^3+3x^2-4, complete the table of coordinates below. Use these coordinates to plot the graph between x=-4 and x=1.
[2 marks]

We will complete this table by substituting in the values of x to get the missing values of y. For example, when x=-2,
y=(-2)^3+3(-2)^2-4=-8+12-4=0
Continuing this with the rest of the x values, we get the completed table below.

Then, plotting these points on a pair of axes and joining them with a curve, we get the graph below.
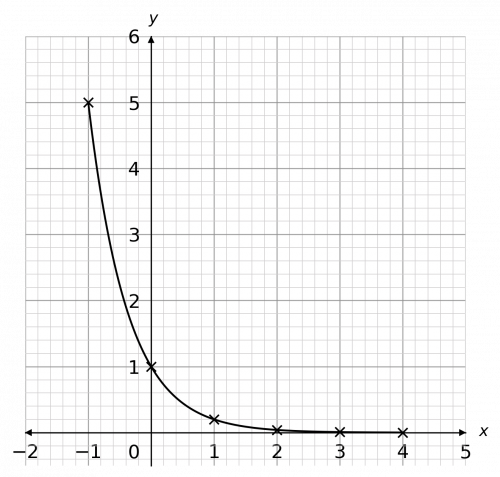
Question 3: Using the equation y=(0.2)^x, complete the table of coordinates below. Use these coordinates to plot the graph between x=-1 and x=4.
[2 marks]

We will complete this table by substituting in the values of x to get the missing values of y. For example, when x=2,
y=(0.2)^2=0.04
Continuing this with the rest of the x values, we get the completed table below.

Then, plotting these points on a pair of axes (to the best of your ability – some of the y values are so small they’re going to end up practically on the x-axis) and joining them with a curve, we get the graph below.
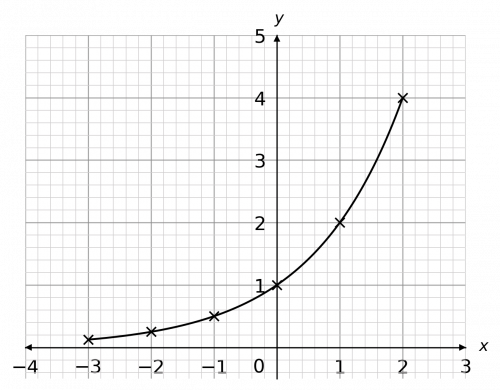
Question 4: Using the equation y=2^x, draw a table of coordinates from x=-3 to x=2.
Use the values to plot the graph between these x values.
[2 marks]
We draw this table by substituting the x values into the equation. For example, for x=1, we get
y=2^1=2.

Carrying this on with the rest of the numbers, we get the table above. Then, plotting these points and joining them with a curve, we get the graph to the right.
The exponential graph also has an asymptote along the x-axis. Its shape varies very little, except that when the base of the exponential (here, the function is 2^x so the base is 2) is a number between 0 and 1, the shape of the graph is a mirror image of this one. Specifically, a reflection in the y-axis.
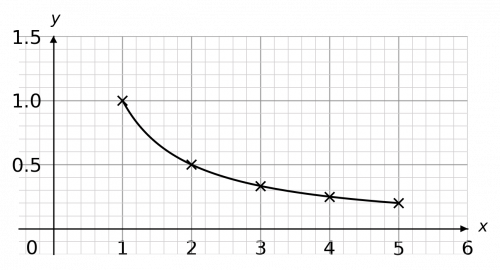
Question 5: Using the equation y=\dfrac{1}{x}, draw a table of coordinates from x=1 to x=5. Use the values to plot the graph between x=1 and x=5.
[2 marks]
We draw this table by substituting the x values into the equation. For example, for x=2, we get
y=\dfrac{1}{2}=0.5.

Then, plotting these points on a pair of axes and joining them with a curve, we get the graph below.
Quadratics and Harder Graphs Worksheet and Example Questions
(NEW) Plotting Quadratics and Harder Graphs Exam Style Questions
Level 4-5Level 6-7GCSEQuadratics and Harder Graphs Drill Questions
Drawing Quadratic Graphs
Level 4-5GCSEPlotting Quadratics and Harder Graphs
Level 4-5GCSEPlotting Harder graphs
Level 6-7GCSE
MME Premium Membership
£19.99
/monthLearn an entire GCSE course for maths, English and science on the most comprehensive online learning platform. With revision explainer videos & notes, practice questions, topic tests and full mock exams for each topic on every course, it’s easy to Learn and Revise with the MME Learning Portal.
Sign Up Now