Revise
Relative Frequency
Relative Frequency Revision
Relative Frequency
There are two types of probability you will see:
- Theoretical probability – this is the kind of probability that we have prior understanding of. For example, we know that the chance of rolling a 6 on a fair die is \dfrac{1}{6}.
- Relative frequency – this is the kind of probability that we determine from a survey or experiment.
Make sure you are happy with the following topics before continuing.
Relative Frequency
We calculate relative frequency using the following formula:
\text{relative frequency }=\dfrac{\text{no. of times an outcome happened}}{\text{total no. of all outcomes}}
Example: A coin is flipped 100 times, the coin lands on heads 48 times.
Calculate the relative frequency for heads.
\text{relative frequency }=\dfrac{48}{100} =0.48
for landing on heads.
Expected Frequency
We can use relative frequency to determine expected frequency, which is the number of times we would expect an outcome to happen. It is calculated as follows:
\text{expected frequency }=\text{ probability }\times\text{number of trials}
Example: If we roll a dice 60 times, the expected frequency of sixes is
\dfrac{1}{6}\times60= 10
Note: In practice, it probably won’t end up being exactly 10 times,
i.e. Our relative frequency won’t be \dfrac{1}{6}. However, if you do more trials, the relative frequency will get closer to the expected frequency.


Bias
One of the key uses of relative frequency is in testing for bias. We say that an experiment is biased when the probability of a particular outcome is unfairly bigger or smaller than it should be.
Example: A biased coin might be cleverly designed so that it’s lands on tails more than 50\% of the time. If we suspect a coin of being biased, then we test it by flipping it a lot of times and recording the results. Then, if the relative frequency of tails is noticeably more than 50\%, we might suspect the coin of being biased.
Example 1: Relative Frequency
Prim asks some people in her town about their dietary habits and records the results in the table below.

a) Work out the relative frequency of someone in Prim’s town being vegetarian.
b) There are 20,000 people in Prim’s town. Using your answer to part a), find an estimate for the number of people in this town who are vegetarian.
[4 marks]
a) Firstly, we need the total number of all outcomes:
\text{total }=44+23+43=110
Now, using the formula shown above, we can calculate the relative frequency for vegetarians to be
\text{relative frequency }=\dfrac{44}{110}=\dfrac{2}{5}
b) Our answer to part a) suggests that if we picked a random person in Prim’s town, there would be a \dfrac{2}{5} or 0.4 chance that they are vegetarian. Therefore
\dfrac{2}{5}\times 20,000=8,000\text{ vegetarians}
Example 2: Relative Frequency and Bias
Amber has a spinner with the numbers 1, 2, 3 and 4 on it. She was told that the spinner is fair, i.e. there is an equal chance of landing on any number when you spin it, but she claims that the spinner is biased.
Amber spins the spinner 150 times and it lands on the number one 54 times. By calculating the relative frequency of landing on 1, comment on Amber’s claim.
[3 marks]
Firstly, the relative frequency:
\text{relative frequency of landing on 1 }=\dfrac{54}{150}=0.36
So, the relative frequency is 0.36, or 36\%.
But we know there are 4 equally likely outcomes on the spinner, meaning the theoretical probability of landing on 1 is
\dfrac{1}{4}=25\%
25\% is significantly smaller than 36\%, so it seems that Amber has good to reason to make the claim she does. The results suggests the spinner is biased.
Note: We don’t know this for sure. It’s possible that a fair spinner could land on the number one 54 times due to chance, but it is unlikely, which leads us to believe the spinner is biased.
We can always do a better experiment and make our conclusion more confident by increasing the number of trials!
Relative Frequency Example Questions
Question 1: Som asks 52 people in his school how they travelled to school that morning and records the results in the table below:

Find the relative frequency of:
a) A student travelling to school on public transport,
b) A student walking to school,
c) A student not cycling to school.
Give all your answers to 3 decimal places.
[4 marks]
a) 12 students out of the total of 52 used public transport so, as a fraction, this can be expressed as:
\dfrac{12}{52}
To calculate the relative frequency as a decimal to 3 decimal places, divide the top by the bottom:
\dfrac{12}{52}=0.231 to 3 decimal places
b) 16 students out of the total of 52 walked to school so, as a fraction, this can be expressed as:
\dfrac{16}{52}
To calculate the relative frequency as a decimal to 3 decimal places, divide the top by the bottom:
\dfrac{16}{52}=0.308 to 3 decimal places
c) If 9 of the 52 students cycled, then the number who didn’t cycle is:
52-9=43
As a fraction, this can be expressed as:
\dfrac{43}{52}
To calculate the relative frequency as a decimal to 3 decimal places, divide the top by the bottom:
\dfrac{43}{52}=0.827 to 3 decimal places

Question 2: Bev claims that a 6-sided die is biased. She thinks that 6 is more likely to occur than any other number. To test this, she rolls the die 400 times. It lands on a six 63 times in total. Comment on the truth of Bev’s claim.
[3 marks]
In Bev’s experiment, the relative frequency of rolling a 6 is:
\dfrac{63}{400}=0.1575
The probability of rolling a 6 is:
\dfrac{1}{6}=0.166666...
The two results are fairly similar, in fact in Bev’s experiment she has successfully thrown a 6 slightly less often than would be expected, although not by a significant amount.
So, we can conclude that Bev’s statement is false. The die does not appear to be biased.
Question 3: Hannah wants to know how many cars are silver in her town. To do so, she counts the cars that pass by her window and note if they are silver or not. Hannah spends 30 minutes looking at cars in the morning and then spends 1 hour counting cars in the evening.
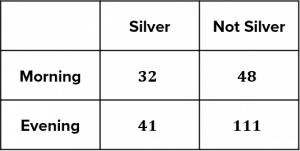
a) Based on her morning data, Hannah claims that 40\% of the cars in her town are silver. Comment on the accuracy of her claim.
b) Using all the data collected, calculate the relative frequency of a car being silver to 3 decimal places.
c) Given that there are 5,000 cars in the town, use your answer to part b) to work out the expected frequency of silver cars in the town.
[5 marks]
a) The relative frequency of silver cars using Hannah’s morning data can be calculated as follows:
\dfrac{32}{32+48}=0.4=40\%.
So, according to her data, her statement is correct.
b) To calculate the relative frequency based on all the data collected, we will need to combine Hannah’s data.
The total number of cars spotted was 32 +41 + 48 + 111 = 232\text{ cars}.
The total number of silver cars spotted was 32+41=73\text{ silver cars}
The relative frequency of a car being silver using all the data can be calculated as follows:
\dfrac{73}{232}=0.315 to 3 decimal places
c) To find the expected frequency of silver cars, we will multiply the probability of a car being silver (i.e., the relative frequency calculated in part b) by the total number of cars. The expected frequency of silver cars in the town is therefore:
0.315\times5,000=1,575 silver cars
Question 4: Bob rolls an 8-sided die one hundred times and 7 comes up 15 times. Susan rolls the same die 500 times and throws a 7 on 60 occasions.
a) What is the probability of Bob throwing a 7?
b) What is the probability of Susan throwing a 7?
c) Whose results are more accurate and why?
[3 marks]
a) Bob throws the die 100 times and throws a 7 on 15 occasions. As a fraction this can be written as:
\dfrac{15}{100}
The probability of Bob throwing a 7 is the decimal equivalent of the above fraction, which we can calculate by dividing the numerator by the denominator:
15\div100 = 0.15
b) Susan throws the die 500 times and throws a 7 on 60 occasions. As a fraction this can be written as:
\dfrac{60}{500}
The probability of Susan throwing a 7 is the decimal equivalent of the above fraction, which we can calculate by dividing the numerator by the denominator:
60\div500 = 0.12
c) Susan’s results are more accurate because the more times you conduct an experiment, the more accurate the estimate will be.
Question 5: On the final night of a school trip to London, the students were asked what they would like for their evening meal. Their meal choices and the relative frequency of each is stated below:
Pizza Cottage: 0.4
Dazza’s Fish and Chips: 0.5
Burger Queen: 0.1
16 people opted for Burger Queen.
a) How many people were on the school trip in total?
b) How many chose Pizza Cottage?
c) How many chose Dazza’s Fish and Chips?
[6 marks]
a) Since the relative frequency for Burger Queen is 0.1, we should be able to turn this into a fraction without too much difficulty:
0.1 = \dfrac{1}{10}
We know that 16 people in total opted for Burger Queen, therefore:
\frac{1}{10} = 16\text{ students}
If 16 students represents \frac{1}{10} of the total number of students, then the total number of students on the trip can be calculated as follows:
16\text{ students}\times10 = 160\text{ students}
b) The relative frequency of Pizza Cottage is 0.4 which, as a fraction is \frac{4}{10}. If there are 160 students in total and \frac{4}{10} chose Pizza Cottage, then the number of students who chose Pizza Cottage can be calculated as follows:
\dfrac{4}{10}\times160\text{ students} = 64\text{ students}
c) The relative frequency of Dazza’s Fish and Chips is 0.5 which, as a fraction is \frac{5}{10} or \frac{1}{2}. If there are 160 students in total and \frac{1}{2} chose Dazza’s Fish and Chips, then the number of students who chose Dazza’s Fish and Chips can be calculated as follows:
\dfrac{1}{2}\times160\text{ students} = 80\text{ students}
or
160\text{ students}\div2 = 80\text{ students}
Relative Frequency Worksheet and Example Questions
(NEW) Relative Frequency Exam Style Questions - MME
Level 4-5GCSENewOfficial MME
MME Premium Membership
£19.99
/monthLearn an entire GCSE course for maths, English and science on the most comprehensive online learning platform. With revision explainer videos & notes, practice questions, topic tests and full mock exams for each topic on every course, it’s easy to Learn and Revise with the MME Learning Portal.
Sign Up Now