Revise
Solving Simultaneous Equations with Graphs
Solving Simultaneous Equations with Graphs Revision
Solving Simultaneous Equations using Graphs
Two equations are simultaneous if they are both true at the same time and for the same values of x and y.
Simultaneous equations can be solved using algebra, but here we’re going to go through the process of solving them using graphs.
There are 2 types of simultaneous equations you need to know about.
Make sure you are happy with the following topics before continuing:

Type 1: Two Linear Graphs
It is possible to solve linear simultaneous equations with graphs by finding where they intersect.
Example: By plotting their graphs, for values of x between -1 and 4, on the same axes, find the solution to the two simultaneous equations below.
\begin{aligned}y&=2x-5 \\ y&=-x+4\end{aligned}
Step 1: Plot both straight line graphs on the same axes.
Step 2: Look for where the graphs intersect.
As we can see, these straight lines cross at 1 point (circled in red).
The coordinates of this point, (3, 1), provide the solution to this problem.
Therefore, the solution is
x=3,\,\,\,y=1


Type 2: Linear and Non-Linear Graphs
Like linear simultaneous equations, non-linear simultaneous equations can also be solved by finding the intersection point, however this time there are two solutions.
Example: By plotting their graphs on the same axes, find the solution to the two simultaneous equations below.
\textcolor{blue}{y=x+2}
\textcolor{red}{y=x^2-4}

Step 1: Plot both the straight line graph and the quadratic graph on the same axes.
(Revise plotting straight line graphs here)
Step 2: Look for where the graphs intersect (circled in green).
As this is a linear and non-linear problem, there will more more than 1 intersection. In this case there will be 2.
As we can see, the two graphs intersect at the following coordinates:
(-2,0) and (3, 5)
Therefore, the two solutions to the equations are
x=-2,\,\,\,y=0 and x=3,\,\,\,y=5
Solving Simultaneous Equations with Graphs Example Questions
Question 1: By plotting their graphs for values of x between -2 and 3 on the same axes, find the solution to the following pair of simultaneous equations.
\begin{aligned}y&=-2x+1 \\ y&=-x-1\end{aligned}
[3 marks]
So, we want 3 points in order to plot each line. Subbing in some values of x into the first equation, we get
x=-2 gives y=-2\times (-2)+1=5
x=0 gives y=-2\times (0)+1=-1
x=3 gives y=-2\times (3)+1=-5
So, our 3 coordinates to plot are
(-2, 5),\,\,(0, -1),\,\,(3, -5)
Then, doing the same for the second equation, we get
x=-2 gives y=-(-2)-1=1
x=0 gives y=-(0)-1=-1
x=3 gives y=-(3)-1=-4
So, our 3 coordinates to plot are
(-2, 1),\,\,(0, -1),\,\,(3, -4)
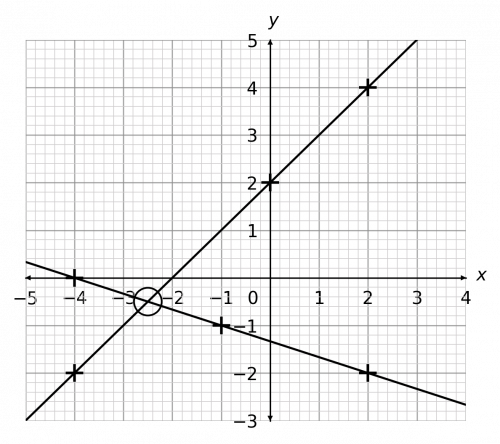
Plotting these points and drawing the lines, we get the graph shown below.
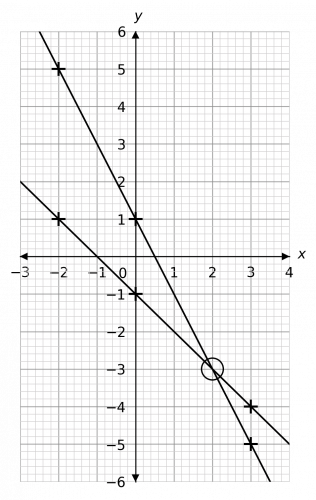
As we can see, the coordinates where the lines cross are (2, -3). Therefore, the solution is
x=2,\,\,\,\,\,y=-3

Question 2: By plotting their graphs for values of x between -3 and 2 on the same axes, find the solution to the following pair of simultaneous equations.
\begin{aligned}y&=2x+2 \\ 2y&+3x=-3\end{aligned}
[3 marks]
Before we can plot any points, we need to rearrange the second equation to be in a form we can use. So, subtracting 3x from both sides, we get
2y=-3x-3
Then, dividing both sides by 2 we get the desired form:
y=-1.5x-1.5
Now we’ve sorted that out, we want 3 points in order to plot each line. Subbing in some values of x into the first equation, we get
x=-3 gives y=2\times (-3)+2=-4
x=0 gives y=2\times (0)+2=2
x=2 gives y=2\times (2)+2=6
So, our 3 coordinates to plot are
(-3, -4),\,\,(0, 2),\,\,(2, 6)
Then, doing the same for the (rearranged) second equation, we get
x=-3 gives y=-1.5 \times (-3)-1.5=3
x=0 gives y=-1.5 \times (0)-1.5=-1.5
x=1 gives y=-1.5 \times (1)-1.5=-3
So, our 3 coordinates to plot are
(-3, 3),\,\,(0, -1.5),\,\,(1, -3)
Plotting these points and drawing the lines, we get the graph shown below.
As we can see, the coordinates where the lines cross are (-1, 0). Therefore, the solution is
x=-1,\,\,\,\,\,y=0
Question 3: By plotting their graphs for values of x between -4 and 2 on the same axes, find the solution to the following pair of simultaneous equations.
\begin{aligned}y&=x+2 \\ 3y&+x=-4\end{aligned}
[3 marks]
The process for this will be exactly the same as the last one with one extra step right here at the beginning. The second equation is written it an unusual form, and in order to be able to substitute x values into it, we need to have it written in the form ”y=...”.
So, we must rearrange! Firstly, subtract x from both sides to get
3y=-x-4
Then, divide both sides by 3 to get
y=-\dfrac{1}{3}x-\dfrac{4}{3}
Yikes, this is pretty unpleasant. That’s okay, we have a calculator. Remember, we only need 3 points, so try substituting in different values of x with your calculator until you get some nice whole number answers (just to make plotting easier). Doing this, we get
x=-4 \text{ gives } y=-\dfrac{1}{3}\times (-4)-\dfrac{4}{3}=0
x=-1 \text{ gives } y=-\dfrac{1}{3}\times (-1)-\dfrac{4}{3}=-1
x=2 \text{ gives } y=-\dfrac{1}{3}\times (2)-\dfrac{4}{3}=-2
So, our 3 coordinates to plot are
(-4, 0),\,\,(-1, -1),\,\,(2, -2)
Then, for the second equation, our three y values will be
x=-4 gives y=-4+2=-2
x=0 gives y=0+2=2
x=2 gives y=2+2=4
So, our 3 coordinates to plot are
(-4, -2),\,\,(0, 2),\,\,(2, 4)
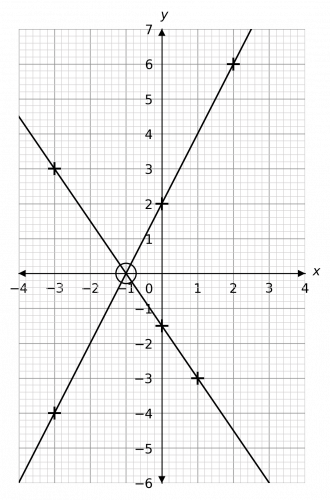
Plotting these points and drawing the lines, we get the graph shown below.
Looking at where the graphs cross, we can see that – whilst the coordinates of it are not whole numbers – the point is halfway between -2 and -3 on the x axis and halfway between 0 and -1 on the y axis.
So, it’s coordinates are: (-2.5, -0.5), and therefore the solution is
x=-2.5,\,\,\,y=-0.5
NOTE: This will only be clear if the graphs are drawn as accurately as possible. Rough sketches of lines will not give you accurate solutions.
Question 4: By sketching a graph, or otherwise, solve the simultaneous equations:
y=x^{2}-3x+2
y=2-x
[5 marks]
Step 1: Plot both the straight line graph and the quadratic graph on the same axes.
Step 2: Look for where the graphs intersect (circled in green). These are the solutions.
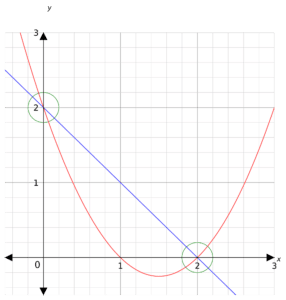
Hence, the solutions are x=0, y=2 and x=2, y=0
Question 5: By sketching a graph, or otherwise, solve the simultaneous equations:
y=x^{2}-2x+1
y=x+1
[5 marks]
Step 1: Plot both the straight line graph and the quadratic graph on the same axes.
Step 2: Look for where the graphs intersect (circled in green). These are the solutions.
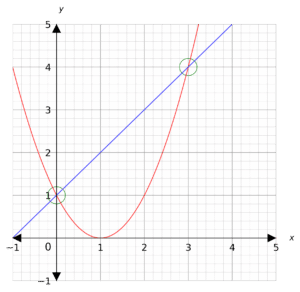
Hence, the solutions are x=0, y=1 and x=3, y=4
