Revise
Two-Way Tables
Two-Way Tables Revision
Two-Way Tables
Two-way tables show information about two characteristics, one being presented in the columns and one presented in the rows.
For example, a table may show the amount of boys and girls who preferred football or rugby.
You will need to able to construct two-tables as well as use them to calculate probabilities of specific events occurring.
Understanding Two-Way Tables
The following two-way table shows information about the hair colour of 100 children:

What do the values mean?
Examples:
There are \textcolor{blue}{10} boys with black hair.
There are \textcolor{green}{18} children with blonde hair.
There are \textcolor{pink}{55} girls.
There are \textcolor{orange}{100} children overall.
Completing Two-Way Tables
You may be asked to complete incomplete two-way tables.
The following two-way table shows information about the hair colour of another 100 children, with some missing values:

In this table, we need to find the missing values, \textcolor{red}{a} and \textcolor{blue}{b}:
\textcolor{red}{a}: we know there are 36 children with brown hair, and 21 of these are boys, so we can find how many girls have brown hair:
36-21=15\\ \textcolor{red}{a} = 15
\textcolor{blue}{b}: we know there are 100 children overall, and 51 of these are boys, so we can find how many girls there are overall:
100-51=49\\ \textcolor{blue}{b} = 49


Finding Probabilities from Two-Way Tables
Two-way tables also allows us to calculate probabilities.
The following two-way table shows information about how 50 people travel to school or work:

Examples of calculating probability:
- One person from this table is chosen at random. Calculate the probability of this person being under 25 years old and walking to school or work.
From the table, we can see 11 under 25‘s walk to school or work, out of a possible 50 people.
Therefore, the probability is \dfrac{11}{50}.
- One person from this table is chosen at random. Calculate the probability of this person travelling by bus to school or work.
From the table, we can see 7 people in total take the bus, out of a possible 50 people.
Therefore, the probability is \dfrac{7}{50}.
Conditional Probabilities from Two-Way Tables
We can also calculate conditional probabilities from two-way tables.
The following two-way table shows information about how 50 people travel to school or work:

Conditional probability example:
- One person from this table is chosen at random. Given that the person chosen is over 25, calculate the probability of this person driving in a car to school or work.
We are given that the person is over 25, and as there are 25 people over this age, this is the total number of possible people that can be chosen.
From the table, we can see 12 over 25‘s drive to school or work.
This gives us a probability of 12 out of a total 25 people:
\dfrac{12}{25}
Example 1: Probability
The following table shows the favourite colours of Year 7 and Year 8 students.

A student is chosen at random. Find the probability of this student’s favourite colour being red.
[2 marks]
From the table we can see that 11 students’ favourite colour is red, out of a possible 30:
Probability = \dfrac{11}{30}
Example 2: Conditional Probability
The following table shows the favourite colours of different Year 7 and Year 8 students.

A year 8 student is chosen at random. Find the probability of this student’s favourite colour being green.
[3 marks]
We are given that the student is in Year 8, and as there are 14 students in this year, this is the total number of possible people that can be chosen.
From the table, we can see 3 Year 8 students chose green as their favourite colour.
This gives us a probability of 3 out of a total 14 people:
\dfrac{3}{14}
Two-Way Tables Example Questions
Question 1: The following table shows some primary and secondary school students’ favourite subjects. Find the missing values a, b and c.
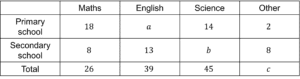
[2 marks]

Question 2: The following table shows some people’s favourite sports.
A random person is chosen from the group. Calculate the probability of the person chosen’s favourite sport being tennis.

[2 marks]
Total: 40 people
People with favourite sport as tennis: 11
Probability: \dfrac{11}{40}
Question 3: The following table shows some students favourite art activity.
Given that a girl is chosen at random, calculate the probability of the girl’s favourite art form being painting.

[3 marks]
Total girls: 32
Girls with favourite art as painting: 6
Probability: \dfrac{6}{32}
This could be simplified down to \dfrac{3}{16}
