Graphical Inequalities
Graphical Inequalities Revision
Graphical Inequalities
Graphical inequalities display inequalities on x–y graphs by shading in the areas the inequality holds true.
We will look at linear inequalities where the inequality is a relationship between x and y and how that looks on a graph.
Make sure you are already familiar with inequalities.
Simple Inequalities for x

The area that satisfies the inequality is the shaded region.
x < 3
That means that x is less than 3, so everything to the left of x=3 is shaded on the graph, as that is where x is less than 3. Everything to the right is not shaded, as there the inequality is not true.
On the border of the shaded area we must draw a line. The style of the line depends on whether or not the inequality is true on the line. So for
x < 3 we draw a dashed line at x=3
x \leq 3 we draw a solid line at x = 3
We only draw a solid line if the inequality holds on the line. So as x<3, then the inequality is not true at x=3, as 3 is not less than 3. Therefore we draw a dashed line.

You have to check every border that the shaded region will have, for example
-3 \leq x < 1.5
has two borders. One on x = -3 and one on x = 1.5.
The border at x = -3 must be a solid line as x=-3 satisfies the inequality. x=1.5 on the other hand must be dashed as it does not satisfy the inequality.
Simple Inequalities for y

The same principles work for inequalities of y, except this time the borders to the shaded region are horizontal. You shade below a border if y is less than it, and above the border if y is more than it. This is as y increases upward.
Once again, if the inequality is < or >, as in it cannot be equal, then the border is drawn with a dashed line.
If the inequality is \leq or \geq, as in it can be equal, then the border is a solid line.
For example
-3 \leq y < 1.5
would look like the figure on the right.
Linear Inequalities

There may be a linear inequality between x and y at which point you may need to rearrange it into either
y < mx + c shaded below the dashed line y=mx+c
y \leq mx + c shaded below the solid line y=mx+c
y > mx + c shaded above the dashed line y=mx+c
y \geq mx + c shaded above the solid line y=mx+c
where y = mx +c is a straight line equation, with gradient m and y-intercept c.
More about straight line equations here. Make sure you are familiar with them.
Example: The inequality
2y + 2 < 4x
must be rearranged,
2y < 4x -2
y < 2x-1
Remember when manipulating inequalities if you are multiplying or dividing by a negative number you must flip the inequality sign.
So now the line y = 2x -1 will be drawn. As y is strictly less than mx +c, the line shall be dashed, and the area below it shaded.
Combining Inequalities

Inequalities can be combined. When done so the shaded region is the part on the graph where all the inequalities are satisfied at once.
You must draw all the boundaries. Remember if the symbol is \leq or \geq then the line is solid. If the symbol is < or > then the line is dashed.
So if y < 3, x > -3 and y\geq x we should start by sketching all those lines. Then identifying the region where all those things are true.
y < 3 means the region will be below the line y=3
x > -3 means the region will be right of the line x = -3
y \geq x means the region will be above the line y=x
So you shade in where those regions overlap.
Example 1: Simple Inequalities
Shade the region on a graph that satisfies the inequality -3 < x \leq 4, label this region \text{R}.
[2 marks]

-3 < x means that x = -3 will be a dashed line.
x \leq 4 means that x = 4 will be a solid line.
Draw these lines on the graph.
Now we must identify the region that satisfies the inequality.
-3 <x means that the region will be to the right of x = -3
x \leq4 means that the region will be to the left of x = 4
So we will shade the region between the lines, and then label it \text{R}
Example 2: Combined Inequalities
Shade the region on a graph that satisfies the inequalities x > -4, y \geq \dfrac{x}{2} and y \leq -\dfrac{x}{4}+3
Label this region \text{R}.
[4 marks]

We have to look at the border created by each inequality.
x > -4 means that x = -4 will be a dashed line.
y \geq \dfrac{x}{2} means that y = \dfrac{x}{2} will be a solid line.
y \leq -\dfrac{x}{4}+3 means that y = -\dfrac{x}{4}+3 will be a solid line.
Now we must identify the region that needs to be shaded.
x > -4 means that the region will be to the right of x = -4
y \geq \dfrac{x}{2} means the region will be above y = \dfrac{x}{2}
y \leq -\dfrac{x}{4}+3 means the region will be below y = -\dfrac{x}{4}+3
Now we can shade in the region and label it \text{R}
Graphical Inequalities Example Questions
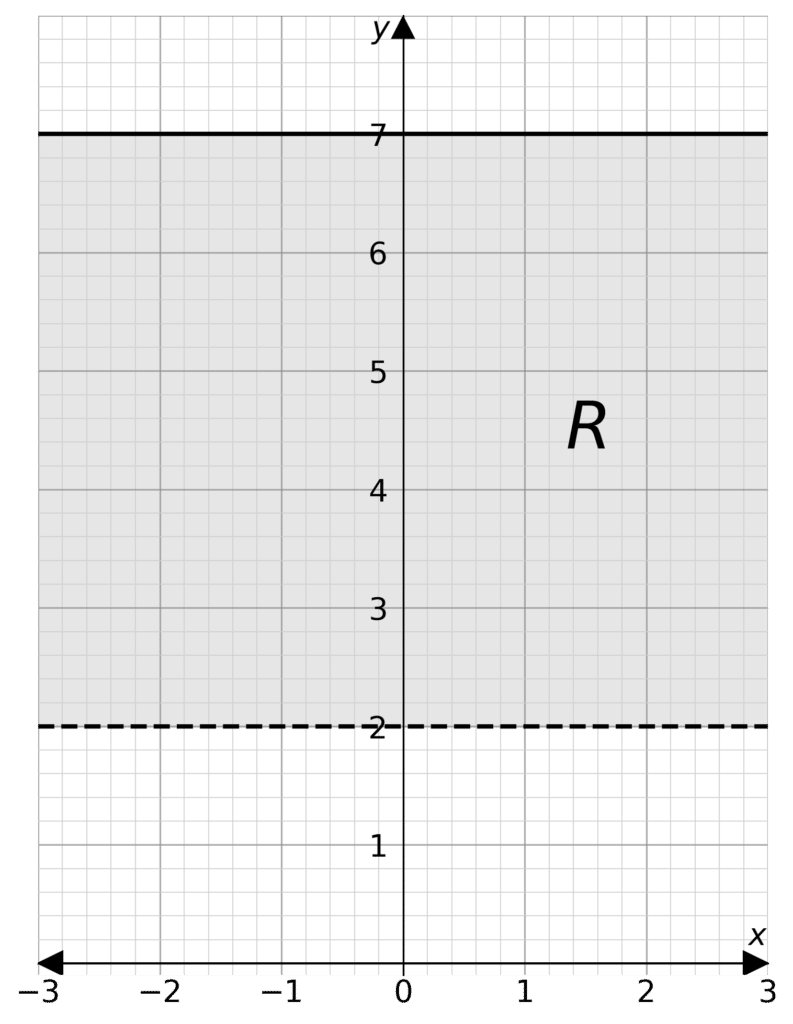
Question 1: Graph the inequality 2< y \leq 7
Label this region \text{R}
[2 marks]
Firstly we shall look at how to draw the borders of the inequality.
2 < y means y = 2 will be a dashed line.
y \leq 7 means y=7 will be a solid line.
Next we have to work out which parts to shade.
2<y means shade above y= 2
y \leq 7 means shade below y =7
So we will shade in the region and label with \text{R}.
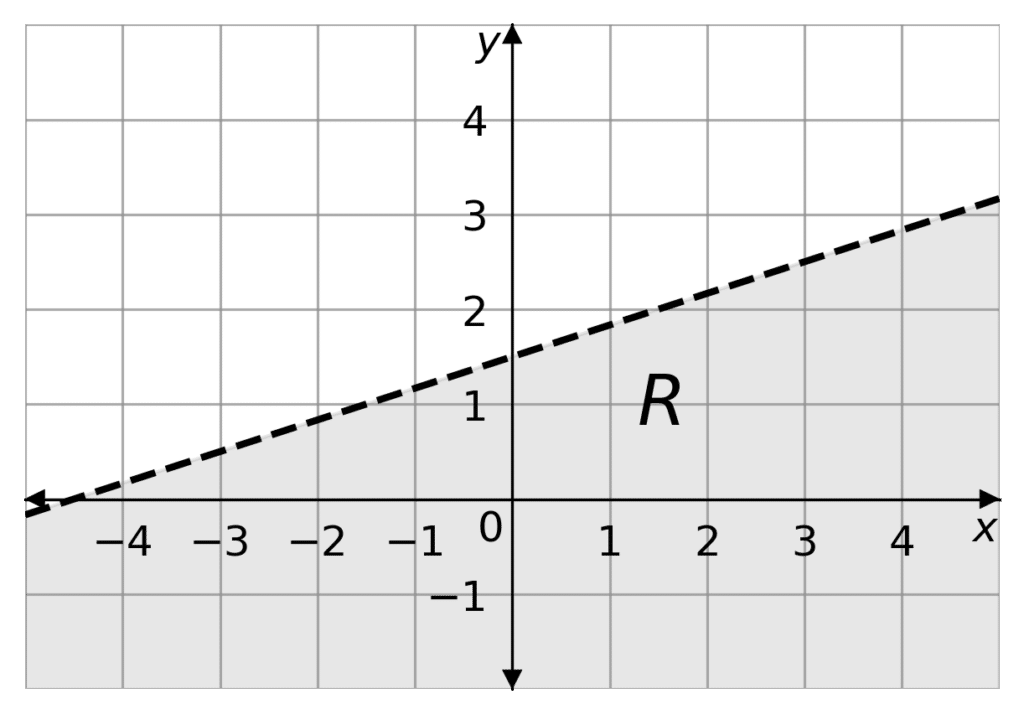
Question 2: Graph the inequality 0 < x -3y +4.5
Label this region \text{R}
[2 marks]
Firstly we need to put the inequality in the form y < mx +c. So
0<x-3y+4.5
3y<x+4.5
y< \dfrac{x}{3}+1.5
This means the border will be a dashed line (as it is < not \leq) and the shaded area will be underneath the border (as y< mx +c not y > mx+c).
So drawing our border and then shading below and labelling it, we get
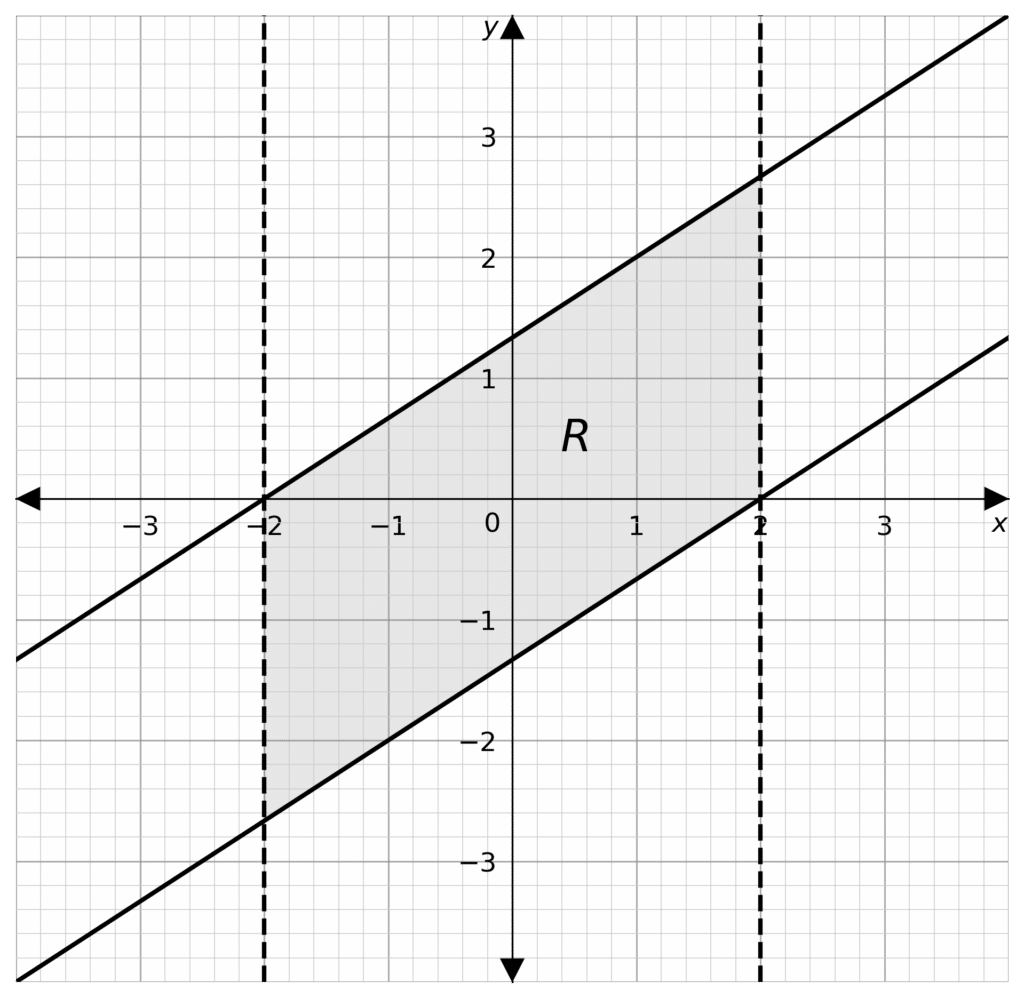
Question 3: Shade the region on a graph that satisfies the inequalities
-2<x<2
y \geq \dfrac{2x}{3} - \dfrac{4}{3}
y \leq \dfrac{2x}{3} + \dfrac{4}{3}
Label this region \text{R}
[5 marks]
We shall look at all the boundaries of the region.
-2<x means x = -2 will be a dashed line with the region to its right.
x< 2 means x = 2 will be a dashed line and the region will be to its left.
y \geq \dfrac{2x}{3} - \dfrac{4}{3} means y =\dfrac{2x}{3} - \dfrac{4}{3} will be a solid line, with the region above it.
y \leq \dfrac{2x}{3} + \dfrac{4}{3} means y =\dfrac{2x}{3} + \dfrac{4}{3} will be a solid line, with the region below it.
Next we draw all the boundaries and shade the region for the inequalities. Then label this \text{R}.
You May Also Like...

MME Learning Portal
Online exams, practice questions and revision videos for every GCSE level 9-1 topic! No fees, no trial period, just totally free access to the UK’s best GCSE maths revision platform.
