Harder Graphs
Harder Graphs Revision
Harder Graphs
Here we shall take a look at some more types of functions which we shall graph. The functions we shall look at are
- Cubic – A function that takes the form f(x)=ax^3
- Reciprocals – A function that takes the form f(x) = \dfrac{a}{x}
- Quadratic reciprocals – A function that takes the form f(x) = \dfrac{a}{x^2}= ax^{-2}
- Exponentials – A function that takes the form f(x) = ab^x+c
Cubic Functions

A cubic function, takes the form
y = ax^3,
Where a is a constant.
This function has a stationary point (a point where the function is neither increasing nor decreasing) at x=0.
Remember if x is negative, then so is x^3. So, if a is positive then the function will come up from the bottom left quadrant, stop increasing at 0 then start increasing again, going up into the top right quadrant of the graph.
If a is negative then the function will decrease as x increases. Coming down from the top left quadrant to it’s stationary point at the origin, then decrease again down the bottom right quadrant. In other words, if a is negative, the graph is reflected on the y-axis.
Remember, the graph will pass through the points (a,1) and (-a,-1) as a\times 1^3 = a.
Reciprocal Functions

A reciprocal function takes the form
y = \dfrac{a}{x} = ax^{-1},
Where a is a constant.
It is worth knowing that reciprocal functions of this form have asymptotes. An asymptote is a line on the graph that the function approaches, but never touches.
For example, x \neq 0, as to do so would be to divide by 0, which we cannot. So f(0) does not exist. The function never crosses the line x=0, so we call the line x=0 an asymptote to y. As x approaches 0 the function gets closer and closer forever, without x ever actually reaching 0.
If y=\dfrac{a}{x}, then
x=\dfrac{a}{y},
which would mean that the line y=0 is also an asymptote. So not only does y not exist when x=0, there is also no y=0.
If a is positive, then y is positive when x is positive, and y is negative when x is negative. So the graph will occupy the bottom left and top right quadrants, where x and y have the same polarity.
If a is negative, then y is negative when x is positive and vice versa. Then the graph will occupy the bottom right and top left quadrants, where x and y have opposite polarity.
In other words, when a is negative the graph is reflected on the x-axis.
This graph will pass through the points (a,1), (-a,-1), (1,a) and (-1,-a), as \dfrac{a}{1}=a and \dfrac{a}{a}=1
If you are as WJEC student, you will only need to study this if you are sitting the higher tier.
Quadratic Reciprocals

A quadratic reciprocal function takes the form
y = \dfrac{a}{x^2} = ax^{-2},
Where a is a constant.
Quadratic reciprocals also have asymptotes. In fact, the same asymptotes, at x=0 and y=0, for much the same reason.
Note that the curve tends towards the x-axis faster than it does the y-axis. Furthermore y is strictly positive, if a is positive. Because x^2 is always positive. So if a is positive then y>0.
Conversely, if a is negative then y is strictly negative (y<0). The graph is reflected along the line y=0
This graph will pass through the points (a,1), (a,-1), (1,a^2) and (1,(-a)^2), as \dfrac{a}{(-1)^2}=a and \dfrac{a^2}{(-a)^2}=1
Exponential Functions

An exponential function takes the form
y = a\cdot b^x +c,
Where a and c are constants, and b is a positive integer.
Firstly we should note that b^x> 0 , this is because when x is negative the function becomes a reciprocal
b^{-x}=\dfrac{1}{b^x}
The reciprocals have an asymptote at y=0. Then b^x has an asymptote at y=0 and, so long as a is positive, so does a \cdot b^x.
As a \cdot b^x > 0 then
y=a \cdot b^x + c > c
So y=c is an asymptote. If a is negative, then this is still an asymptote, just that y<c. The curve is reflected along the line y=c.
Because b^0=1 for all b, then they y-intercept is
y=a \times b^0 +c = a+c
at (a+c, 0). (ab+c, 1) also lies on the graph.
Combining Functions

You may have to combine different types of functions into one graph. The best way to make sure that no mistakes are made is by making a table of values, as these graphs may take irregular shapes.
For example, y=x + \dfrac{1}{x}
We know that x \neq 0 as that would be dividing by 0. So we can fill in our table of values.
We then plot the points, and draw smooth curves between them, unless there is an asymptote between consecutive points.

Example 1: Combined Functions
Complete the table of values and then draw the graph of
y=x^3-3x
for -2\leq x \leq 2.

[4 marks]
Missing from the table are the y values when x = -1, 1 and 2
Substituting these into the equation we get
y= (-1)^3-3(-1)= -1+3 = 2
y= 1^3-3 \times 1= 1-3 = -2
y=2^3-2\times 2= 8-6=2
So the completed table looks like


We can now plot those points on a graph.
We know that the sign of y changes 3 times, so the graph must cross the x-axis three times.
So the smooth graph should look like this, with the points we plotted in blue.
Example 2: Graphing \dfrac{1}{x^2}
Complete the table of values and then draw the graph of
y=\dfrac{1}{x^2}
for -1\leq x \leq 1, x \neq 0

[4 marks]
Missing from the table are the y values when x = -\dfrac{1}{3}, \dfrac{1}{3} and \dfrac{2}{3}
Substituting these into the equation we get
y=\dfrac{1}{(-1/3)^2} = \dfrac{3^2}{1}=9,
y=\dfrac{1}{(1/3)^2} = \dfrac{3^2}{1}=9,
y=\dfrac{1}{(2/3)^2} = \dfrac{3^2}{2^2}=2.25
so the completed table looks like

We can now plot those points on a graph.
We also know the shape of a quadratic reciprocal, and that there are asymptotes on the x and y axes.
So the graph will look like this, with the points we plotted in orange.
If the question asks for it, draw on the asymptotes with dashed line. In this case they would be the lines y=0 and x=0

Harder Graphs Example Questions
Question 1: Complete the table of values for
y=2 \cdot 2^x-2
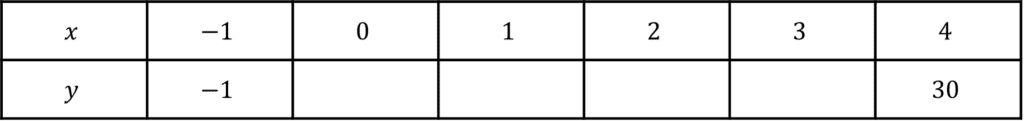
[2 marks]
The missing values in the table are y when x = 0, 1, 2 and 3
y(0)= 2\times 2^0-2 = 2-2=0
y(1)=2\times 2^1-2=4-2=2
y(2)=2\times 2^2-2=8-2=6
y(3)=2\times 2^3-2=16-2=14
So the completed table is 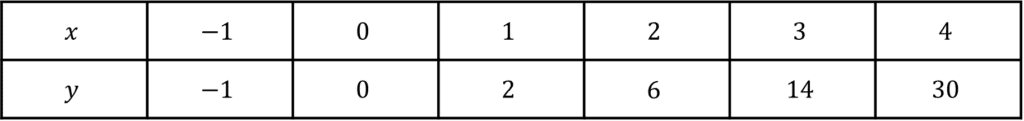
Question 2: Consider the following functions.
| y=3x^2-\dfrac{1}{x} | y=\dfrac{3}{x^2} |
| y=3^x+1 | y=\dfrac{4x^3}{x} |
a) Which function has an asymptote at y=1
[1 mark]
b) Which function would take the shape
a) y=\dfrac{3}{x^2} has asymptotes at x=0 and y=0, not y=1
y=\dfrac{4x^3}{x} is equal to y=3x^2 and so has no asymptotes.
y=3x^2-\dfrac{1}{x} has asymptote x= 0, but not one parallel to the x axis.
y=3^x has an asymptote at y=0, so y=3^x+1 has an asymptote at y=1
y=3^x+1 is the final answer.
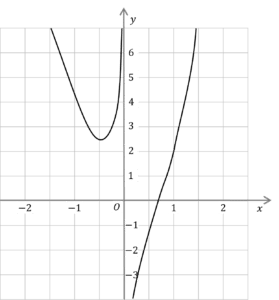
b) The graph clearly has an asymptote at the line x=0. From part (a), both y=\dfrac{3}{x^2} and y=3x^2-\dfrac{1}{x} have asymptotes at x=0, however as y=\dfrac{3}{x^2} is a quadratic reciprocal, it is strictly positive.
So it must be y=3x^2-\dfrac{1}{x}
Question 3: Consider,
y = 2^x+\dfrac{2}{x}
a) Complete the table of values for y
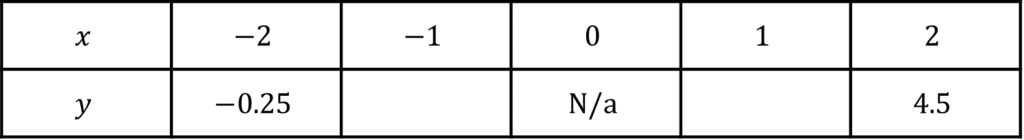
[2 marks]
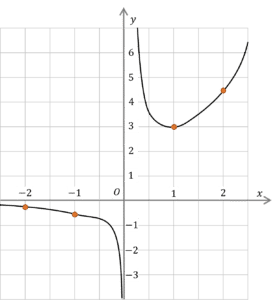
b) Now draw the graph of y = 2^x+\dfrac{2}{x}, for -2 \leq x \leq 2
[2 marks]
a) The missing values in the table are y when x = -1 and 1
y(-1) = 2^{-1}+\dfrac{1}{-1}=\dfrac{1}{2}-1=-0.5
y(1) = 2^1+ \dfrac{1}{1}=2+1 =3
So the complete table is 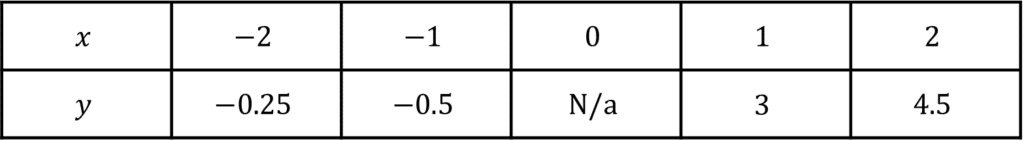
b) There is clearly an asymptote at x=0, and so we can plot the values in the table and join them with smooth lines that never meet the asymptote.
You May Also Like...

MME Learning Portal
Online exams, practice questions and revision videos for every GCSE level 9-1 topic! No fees, no trial period, just totally free access to the UK’s best GCSE maths revision platform.
