Mean and Standard Deviation
Mean and Standard Deviation Revision
Mean and Standard Deviation
Mean, median and mode are averages of data sets – known as measures of central tendency. Range is a measure of the spread of the data. We can also analyse the spread of the data in more sophisticated ways, such as standard deviation.
Recap: Mean, Median, Mode and Range
The mean is the sum of the data points divided by the total number of data points. The median is the middle value of the data points when they are ordered (or the midpoint between the two middle values if there are an even number of data points). The mode is the value that appears the most often. The range is the difference between the highest and the lowest value. The interquartile range is the range after we discard the top and bottom quarters of the data.
Notation for the mean: The mean is often written as \bar{x}=\dfrac{\sum{x}}{n} where x is each data point, or \bar{x}=\dfrac{\sum{fx}}{\sum{f}} where x is a data value and f is the frequency of that data value.
Variance and Standard Deviation
Variance, like range, is a measure of the spread of the data. However, variance is a more intelligent measure than range as it takes all of the data into account. The formula for variance looks a little scary:
\dfrac{\sum{(x-\bar{x})^{2}}}{n} or \dfrac{\sum{x^{2}}}{n}-\bar{x}^{2} or \dfrac{\sum{fx^{2}}}{\sum{f}}-\bar{x}^{2}
It is easier to remember a simple rule:
Variance is (mean of the squares) – (square of the mean)
Standard deviation is the square root of the variance.
\text{standard deviation}=\sqrt{\text{variance}}


Notation for Mean and Variance
The mean can be written as \mathbb{E}(x), which means the expectation or expected value of x.
Note: the mean of the squares is written as \mathbb{E}(x^{2}), so the variance is \mathbb{E}(x^{2})-(\mathbb{E}(x))^{2}
The standard deviation is often written as the Greek letter \sigma, which means that the variance can be written as \sigma^{2}. You may also see the variance written as \text{var}(x).
We can also use Sxy notation:
S_{xy}=\sum{(x-\bar{x})(y-\bar{y})}=\sum{xy}-\dfrac{\sum{x}\sum{y}}{n}
Using this notation, the variance of x is equal to \dfrac{S_{xx}}{n}.
A Level Maths Predicted Papers 2024
The MME A level maths predicted papers are an excellent way to practise, using authentic exam style questions that are unique to our papers. Our examiners have studied A level maths past papers to develop predicted A level maths exam questions in an authentic exam format. The profit from every pack is reinvested into making free content on MME, which benefits millions of learners across the country.

A Level Maths Revision Cards
The best A level maths revision cards for AQA, Edexcel, OCR, MEI and WJEC. MME is here to help you prepare effectively for your A Level maths exams. The profit from every pack is reinvested into making free content on MME, which benefits millions of learners across the country.


Example 1: Finding the Mean and Standard Deviation
Find the mean and standard deviation of 6,10,4,7,24,13,9,15.
[3 marks]
\begin{aligned}\text{mean}&=\dfrac{1}{8}(6+10+4+7+24+13+9+15)\\[1.2em]&=11\end{aligned}
Then to find the standard deviation,
\begin{aligned}&\text{mean of squares}\\[1.2em]&=\dfrac{1}{8}(6^{2}+10^{2}+4^{2}+7^{2}+24^{2}+13^{2}+9^{2}+15^{2})\\[1.2em]&=\dfrac{1}{8}(36+100+16+49+576+169+81+225)\\[1.2em]&=156.5\end{aligned}
\begin{aligned}\text{square of mean}&=11^{2}\\[1.2em]&=121\end{aligned}
\begin{aligned}\text{variance}&=\text{mean of squares}-\text{square of mean}\\[1.2em]&=156.5-121\\[1.2em]&=35.5\end{aligned}
\begin{aligned}\text{standard deviation}&=\sqrt{\text{variance}}\\[1.2em]&=\sqrt{35.5}\\[1.2em]&=5.96\end{aligned}
Example 2: Standard Deviation From Grouped Frequency Table
The number of cars sold by 100 small used car dealerships was monitored over the course of a day. The results have been collated into a table.

What is the mean and standard deviation of the number of cars sold?
[6 marks]
To start, set up a table like this:

\begin{aligned}\text{mean}&=\bar{x}\\[1.2em]&=\dfrac{\sum{fx}}{\sum{f}}\\[1.2em]&=\dfrac{446}{100}\\[1.2em]&=4.46\end{aligned}
\begin{aligned}\text{variance}&=\dfrac{\sum{fx^{2}}}{\sum{f}}-\bar{x}^{2}\\[1.2em]&=\dfrac{2330}{100}-4.46^{2}\\[1.2em]&=23.3-19.8916\\[1.2em]&=3.4084\end{aligned}
\text{standard deviation} = \sqrt{3.4084} = 1.846 (3 dp)
Mean and Standard Deviation Example Questions
Question 1:
Consider the data set 10,4,7,11,3; find its:
a) mean
b) median
c) variance
[4 marks]
a)
\begin{aligned}\text{mean}&=\dfrac{10+4+7+11+3}{5}\\[1.2em]&=7\end{aligned}
b) For the median we must order the data:
3,4,7,10,11We can see that the middle value is 7, so the median is 7
c)
\begin{aligned}\text{variance}&=\dfrac{10^{2}+4^{2}+7^{2}+11^{2}+3^{2}}{5}-7^{2}\\[1.2em]&=\dfrac{100+16+49+121+9}{5}-49\\[1.2em]&=\dfrac{295}{5}-49=59-49\\[1.2em]&=10\end{aligned}Question 2:
If the standard deviation of a data set is 9.2, what is its variance?
If it has a mean of 5, what is the mean of the squares?
[3 marks]
\sigma=9.2
\begin{aligned}\text{variance}&=\sigma^{2}\\[1.2em]&=9.2^{2}\\[1.2em]&=84.64\end{aligned}
\text{variance}=\text{mean of squares}-\text{square of mean}
84.64=\text{mean of squares}-5^{2}
84.64=\text{mean of squares}-25
\begin{aligned}\text{mean of squares}&=25+84.64\\[1.2em]&=109.64\end{aligned}
Question 3:
Mrs Chivers gives her class a spelling test, with ten words. Students receive a score out of 10 corresponding to the number of words they spelt correctly. Calculate the following for the results of the class:
a) the mean
b) the variance
She has collated the result in the table below.
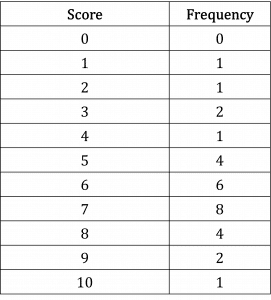
[6 marks]
Set up the table as in the second example:

\begin{aligned}\text{mean}&=\bar{x}\\[1.2em]&=\dfrac{\sum{fx}}{\sum{f}}\\[1.2em]&=\dfrac{185}{30}\\[1.2em]&=6.17\end{aligned}
\begin{aligned}\text{variance}&=\dfrac{\sum{fx^{2}}}{\sum{f}}-\bar{x}^{2}\\[1.2em]&=\dfrac{1265}{30}-6.17^{2}\\[1.2em]&=42.2-38.0\\[1.2em]&=4.14\end{aligned}
You May Also Like...

MME Learning Portal
Online exams, practice questions and revision videos for every GCSE level 9-1 topic! No fees, no trial period, just totally free access to the UK’s best GCSE maths revision platform.
