Revise
Probability and Tree Diagrams
Probability and Tree Diagrams Revision
Probability & Tree Diagrams
Probability is the study of how likely things are to happen. This topic will look at how tree diagrams can be used to determine the probability of different types of events happening.
Make sure you are happy with the following topics before continuing.
Independent and Dependent Events
We need to understand independent and dependent events to be able to do the next sections.
- Two or more events are independent if one event doesn’t effect the probability of the others happening.
- Two or more events are dependent if one event does effect the probability of the others happening.
Example:
- Getting a head both times on 2 coin flips are independent events.
- Picking a red marble at random from a bag, then picking a green marble without replacing the red marble are dependent events.

The AND Rule
- The AND rule states that: If two events, A and B, are independent, then,
\text{P}(A \text{ and } B) = \text{P}(A) \times \text{P}(B)
This means to find the probability of A and B occurring you must multiply the probability of A occurring by the probability of B occurring.
The OR Rule
- The OR rule states that: for two events, A and B, then,
\text{P}(A \text{ or } B) = \text{P}(A) + \text{P}(B) - \text{P}(A \text{ and } B)
- If A and B cannot happen together, we say they are mutually exclusive, and then we have \text{P}(A \text{ and } B) = 0, so the OR rule becomes
\text{P}(A \text{ or } B) = \text{P}(A) + \text{P}(B)
Tree Diagrams

Probability trees are similar to frequency trees, but we instead put the probabilities on the branches and the events at the end of the branch.
Example: A bag contains 4 red balls and 5 blue balls.
Raheem picks 2 balls at random.
Calculate the probability that he selects the same coloured ball each time, given that after each time a ball is selected, it is replaced.
Step 1: Construct the probability tree showing two selections.
We know there are a total of 9 balls in the bag so there is a \dfrac{4}{9} chance of picking a red ball.
Then as the red ball is replaced, there are still 4 red balls left out of 9, so again there is a \dfrac{4}{9} chance of picking a red ball on the second selection.
Continue and fill in the rest.
Step 2: Use the AND rule
From the tree diagram we can see that there are two ways of doing this, either
blue and blue, or red and red
We use the AND rule via the tree diagram, so
\text{P(blue and blue)}=\dfrac{5}{9}\times\dfrac{5}{9}= \textcolor{blue}{\dfrac{25}{81}} \,\, and \,\, \text{P(red and red)}=\dfrac{4}{9}\times\dfrac{4}{9}= \textcolor{red}{\dfrac{16}{81}}
Step 3: Use the OR rule
The final step then is to add the probabilities together, by the OR rule for mutually exclusive events, to get,
\text{P(same colour)}= \dfrac{25}{81} +\dfrac{16}{81}=\dfrac{41}{81}
Tree Diagrams – Events That Are Not Independent

Non-independent probability trees are similar to probability trees, but the probabilities change depending on the previous events.
Example: A bag contains 4 red balls and 5 blue balls.
Raheem picks 2 balls at random.
Calculate the probability that he selects the same coloured ball each time, given that each time a ball is selected, it is not replaced.
Step 1: Construct the probability tree showing two selections,
There are 9 balls to begin with, reducing to 8 after the first selection, as shown below,
The chance of selecting a red ball for the first selection is \dfrac{4}{9}, then with one red ball removed, the second selection is \dfrac{3}{8} and so on….
Step 2: Use the tree diagram to determine the probability of selecting the same colour twice. We can see that there are two ways of doing this, either blue and blue, or red and red. We use the AND rule via the probability tree, so
\text{P(blue and blue)}=\dfrac{5}{9}\times\dfrac{4}{8}= \textcolor{blue}{\dfrac{20}{72}} \text{ and } \text{P(red and red)}=\dfrac{4}{9}\times\dfrac{3}{8}= \textcolor{red}{\dfrac{12}{72}}
Step 3: Add the probabilities together, by the OR rule for mutually exclusive events, to get
\text{P(Same colour)}= \dfrac{20}{72} +\dfrac{12}{72}=\dfrac{32}{72}
Tree Diagrams – Conditional Probability
Tree diagrams can also be used to find conditional probabilities.
Example: Clair has a bag containing 7 blue counters and 4 red counters. She chooses 2 counters at random without replacement. Given that her second counter is a blue counter, find the probability that her first counter was red.
We can draw a tree diagram for this, pictured below.

Recall the formula for probability:
\text{P}(X)=\dfrac{\text{number of ways an outcome can happen}}{\text{total number of possible outcomes}}In this case, since we know her second counter is blue, our possible outcomes are only the branches red then blue \left(\dfrac{28}{110}\right) and blue then blue \left(\dfrac{42}{110}\right).
Our numerator is the single outcome red then blue \left(\dfrac{28}{110}\right), as we want to find the probability that the first counter was red.
\text{P}(\text{first counter red given second counter blue})=\dfrac{\dfrac{28}{110}}{\dfrac{28}{110}+\dfrac{42}{110}}=\dfrac{28}{28+42}=\dfrac{28}{70}=\dfrac{2}{5}
In general, we have the following formula for conditional probability:
\text{P}(A\text{ given }B)=\dfrac{\text{P}(A\text{ and }B)}{\text{P}(B)}
Probability and Tree Diagrams Example Questions
Question 1: Anna and Rob take their driving tests on the same day. The probability of Anna passing her driving test is 0.7. The probability of both Anna and Rob passing is 0.35
(a) Work out the probability of Rob passing his driving test.
(b) Work out the probability of both Anna and Rob failing their driving tests.
[4 marks]
(a) Let “Anna passing” be event A_p and “Rob” passing be event B_p.
To work out the probability of Rob passing we can write the probability of both passing as:
P(A_p \text{ and } R_p) =0.35
Substituting in the probability of Anna passing her test,
0.7 \times P(R_p) =0.35
Rearranging the equation to make P(R_p) the subject:
P(R_p) = 0.35 \div 0.7 = 0.5
(b) The probability of both Anna and Rob failing their driving test can be found using a tree diagram as shown below:
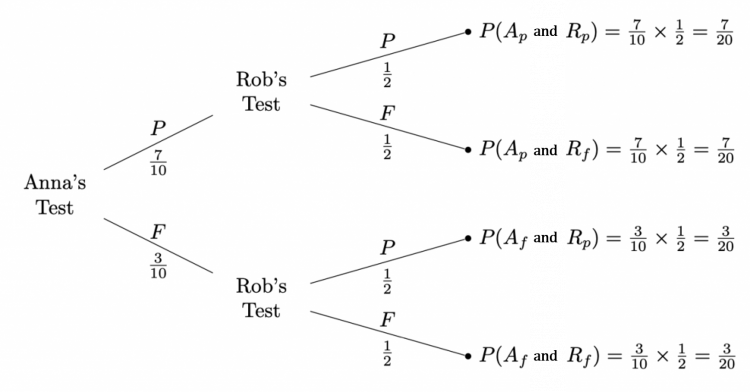
Hence the probability of them both failing is \dfrac{3}{20} = 0.15.

Question 2: There are 12 counters in a bag, 7 are blue and the rest are green.
Sean takes out a counter from the bag at random then, without replacement, takes out another counter.
Work out the probability that the two counters Sean removes are the same colour.
{3 marks]
For this question when drawing the tree diagram we have to be careful as the probability changes between the two events. This is the result of not replacing the first counter hence only leaving 11 counters in the bag to pick from.
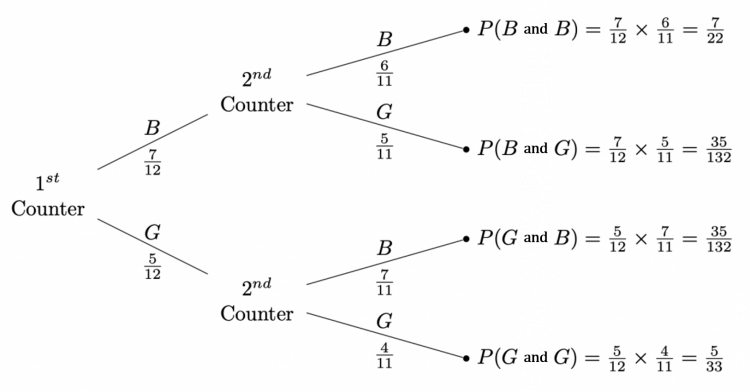
Adding together the probabilities of the result being blue then blue or green then green:
\dfrac{7}{22}+\dfrac{5}{33}=\dfrac{31}{66}
Question 3: The probability that a bus is on time is 0.75
Rory takes the bus to school two days a week. Calculate the probability the bus is late on each of those days.
[3 marks]
To work out the probability of the bus being late on both of the days we can use a tree diagram where E represents the bus being on time or early and L represents the bus being late.
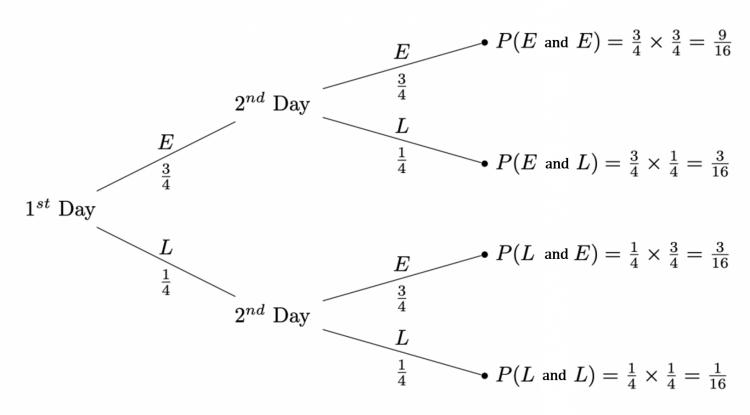
Going along the bottom line we find that the probability of being late of both days is:
\dfrac{1}{16}
Question 4: William enters a badminton competition. The probability he wins a game is 0.6.
(a) Using this information, complete the tree diagram shown below.
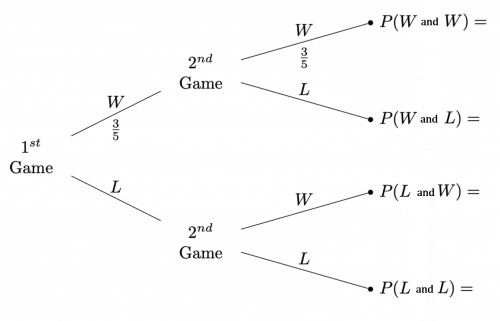
(b) Work out the probability that William wins at least one match.
[4 marks]
(a) The resultant tree diagram should look something like:
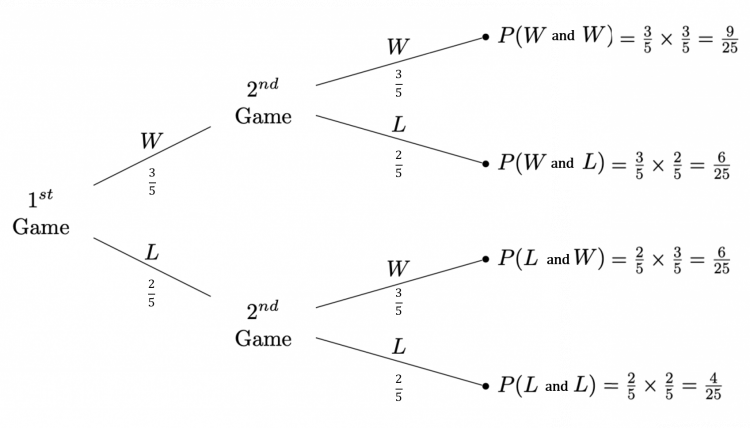
(b) To find the probability he wins at least one game we can simple add the top 3 branches probabilities together or subtract the probability of bottom branch from 1:
\dfrac{9}{25}+\dfrac{6}{25}+\dfrac{6}{25}=\dfrac{21}{25}
or,
1-\dfrac{4}{25}=\dfrac{21}{25}
Question 5: There are 14 footballs in a bag, 9 have a blue pattern design and the rest have green pattern design. The coach takes out a ball out from the bag a random then, without replacement, takes out another one.
Given that the second ball was green, find the probability that the first ball was green.
You must show your workings. Give your answer in its simplest form.
[5 marks]
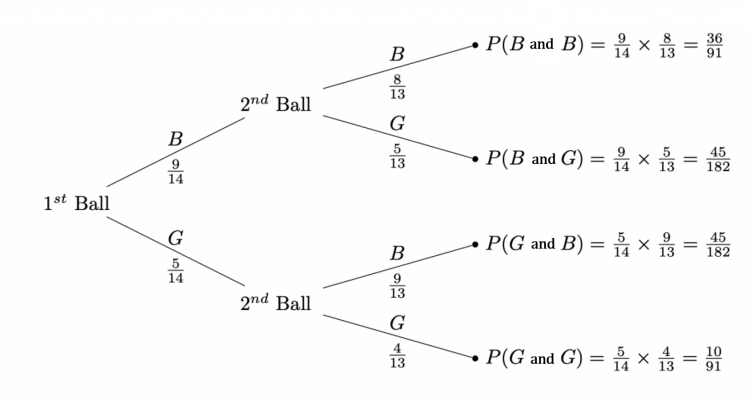
The first thing to do is label the tree diagram and calculate the probabilities for each branch.
Recall the formula for probability:
\text{P}(X)=\dfrac{\text{number of ways an outcome can happen}}{\text{total number of possible outcomes}}
In this case, since we know the second ball is green, out total possible outcomes are only the following:
- Blue then green =\frac{45}{182}
- Green then green =\frac{10}{91}
The outcome we want is green then green, which has a probability of \frac{10}{91}, so this is the numerator.
Hence, we have the following:
\text{P}(\text{first ball green given second ball green})=\dfrac{\frac{10}{91}}{\frac{10}{91}+\frac{45}{182}}
\text{P}(\text{first ball green given second ball green})=\dfrac{20}{20+45}
\text{P}(\text{first ball green given second ball green})=\dfrac{20}{65}
\text{P}(\text{first ball green given second ball green})=\dfrac{4}{13}
