Revise
Gradients of Real Life Graphs
Gradients of Real Life Graphs Revision
Real Life Graphs
Real life graphs are graphs representing real things, these can be straight line graphs and curved graphs.
These graphs can represent anything so getting the basics is important.
Make sure you are happy with the following topics before continuing:
Gradient Represents a Rate of Change
For many real life graphs the gradient will represent the rate.
Take a look at the examples shown.

What rate does each graph represent?
A: Gradient = Litres PER Second (Rate of flow)
B: Gradient = Cost PER Day (Price per day)
C: Gradient = Metres per second PER second (Acceleration)
Note: C is a curved graph so the gradient changes over time, this means we have to use some other techniques for finding the gradient.


Finding the Average Gradient
You may be asked to find the average gradient between two points.
Example: Sammy is running a 100 m race. His distance from the finish line is plotted on the distance time graph shown.
Calculate his average speed between 4 seconds and 12 seconds.
Give your answer in metres per second (m/s).
Step 1: Draw a line between the two points on the graph at 4 seconds and 12 seconds, shown on the graph below.

Step 2: Find the gradient of the straight line.
\text{Gradient} = \dfrac{\text{Change in }y}{\text{Change in }x} = \dfrac{76-12}{12-4} = \dfrac{64}{8} = 8 m/s
Estimating Rate at a Given Point
We calculate the instantaneous rate of change by drawing a tangent to the curve (a straight line just touching the curve) at the desired point, and then calculating the gradient of this tangent (which can be worked out using standard straight line methods).
This will correspond to the gradient of the curve at that individual point.
Example: The descent of a high altitude weather balloon from 40 km above sea level is shown on the graph shown.
Work out the rate of descent at after 5 minutes.
Give your answer in km per minute (km/min).

To find the descent rate, we can draw a tangent line to the graph at that point and calculate its gradient. We can form a triangle with the hypotenuse being the tangent to the line at x=5 (5 minutes in). This can be seen below.
Hence,
\dfrac{\text{Change in } y}{\text{Change in } x}= \dfrac{45-18.5}{9-1} =3.31 km/min (2 dp).

Example 1: Gradient of a Real-Life Graph
Richmondshire Cars is a taxi company that charge a base rate per journey then a certain amount per mile. Use the graph below to calculate:
i) The base rate charged per journey.
ii) The amount charged per mile.

[3 marks]
i) At 0 miles, the cost is £1, so this must be the base rate per journey.
ii) The cost per mile is the gradient.
\text{Cost per mile}=\dfrac{7-1}{4.8-0}=\dfrac{6}{4.8}=£1.25
Example 2: Instantaneous Rate of Change
Jamie is making popcorn. He records the pops he hears from the pan over 70 seconds.

i) Find the average rate of pops at 40\text{ s}.
ii) By drawing a tangent, or otherwise, find the instantaneous rate of pops at 40\text{ s}.
[3 marks]
i) At 40\text{ s} there have been 44 pops, for an average of \dfrac{44}{40}=1.1 pops per second.
ii) Tangent passes through (40,44) and (50,80).
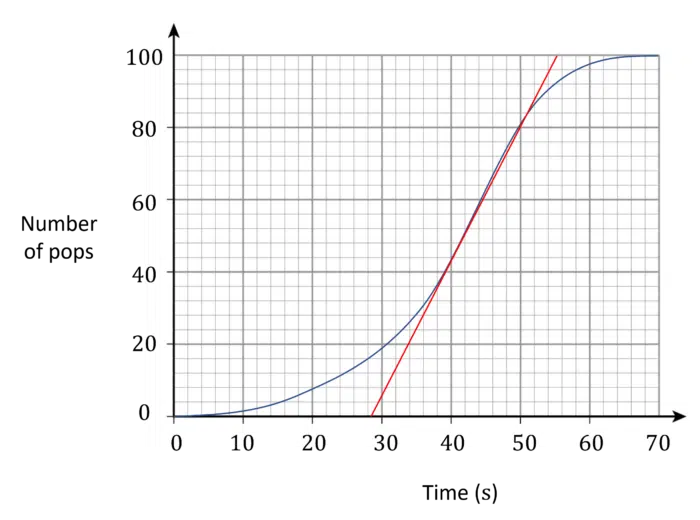
Gradient =\dfrac{80-44}{50-40}=\dfrac{36}{10}=3.6 pops per second.
Gradients of Real Life Graphs Example Questions
Question 1: The graph below shows the prices of petrol and diesel per litre. Work out the price difference between a petrol and diesel car if both have 40 litre fuel tanks.
[2 marks]
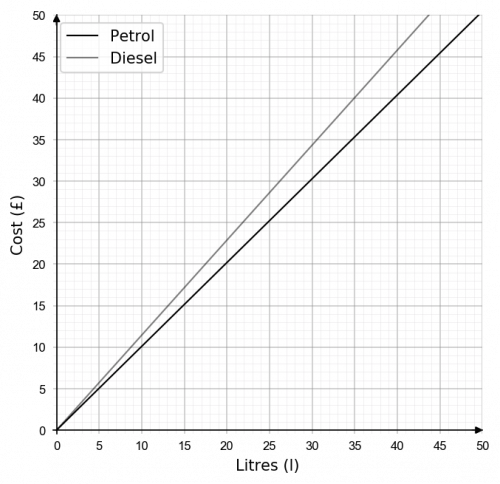
To find each cost corresponding to 40 litres, first locate 40 litres on the x-axis and draw a straight line up to both lines. Next draw a line straight across to the y-axis.
\text{Diesel cost} \approx £46.00
\text{Petrol cost} \approx £40.50
Hence the difference in price for a full 40 litre tank of fuel is,
£46.00 - £40.50 = £5.50

Question 2: The cost to hire a mountain bike for the week is set at a flat rate plus an amount dependant on the length of the hire. This is represented in the graph below. A group of friends want to hire 4 bikes from Monday morning through to Thursday morning. Work out the total cost of hiring the four bikes.
[2 marks]
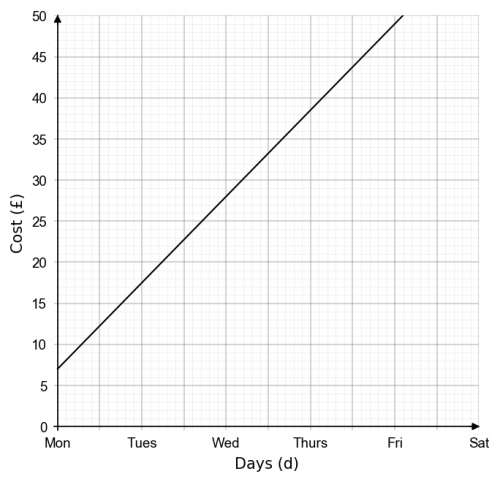
To find the cost of a single hire, locate Thursday on the x-axis and draw a straight line upwards to meet the line. Tracing across to the y-axis we find,
\text{Cost per bike} \approx £38.00
As the group is looking to hire 4 bikes, multiple the cost by four,
\text{Total cost } = £38.00 \times 4 = £152
Question 3: Emma is renovating David’s kitchen. David pays for the cost of the materials, then pays Emma hourly for her labour.
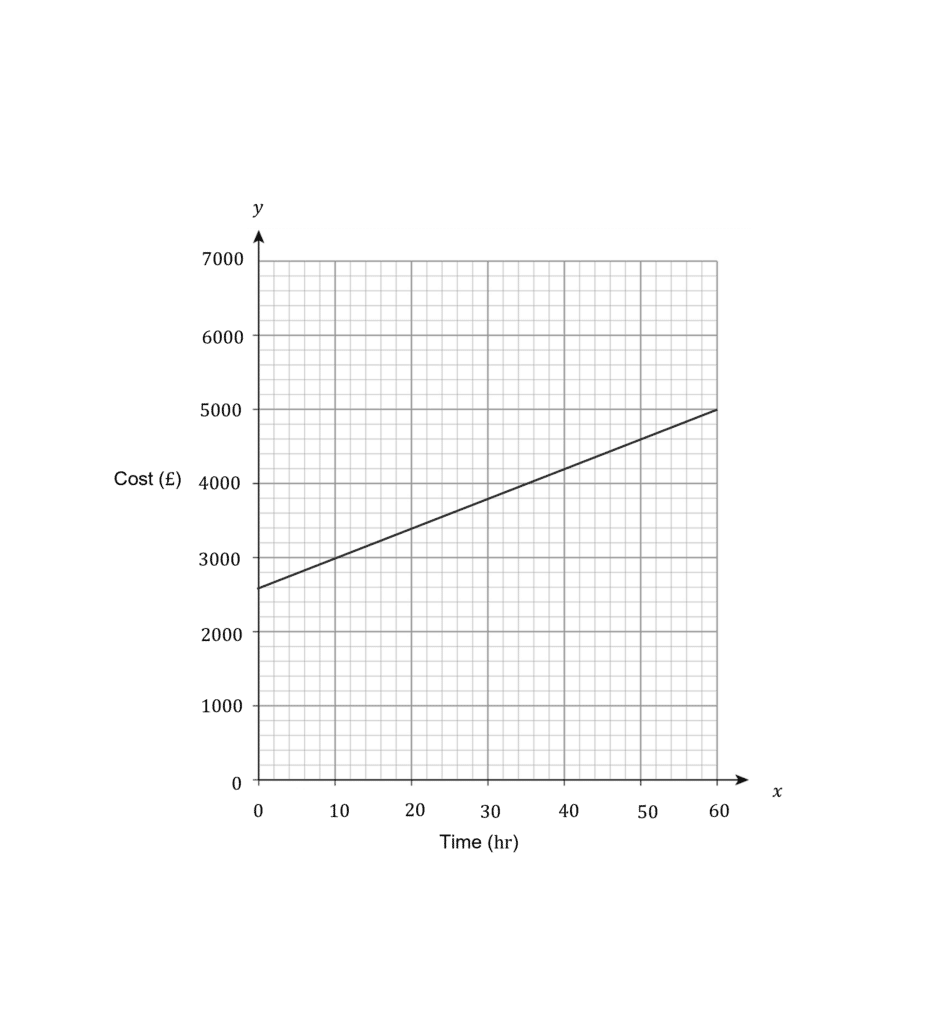
i) How much did the materials for the kitchen cost?
ii) How much does Emma charge per hour?
[3 marks]
i) The cost at 0 hours is the cost of the materials only. This is £2600
ii) Find gradient by choosing two points e.g. (0,2600) and (60,5000).
\text{Gradient}=\dfrac{5000-2600}{60-0}=\dfrac{2400}{60}=£40
Hence, Emma charges £40 per hour.
Question 4: The graph below shows the velocity of a rocket during the first 10 seconds of launch. Work out the acceleration at 5 seconds after launch.
[2 marks]
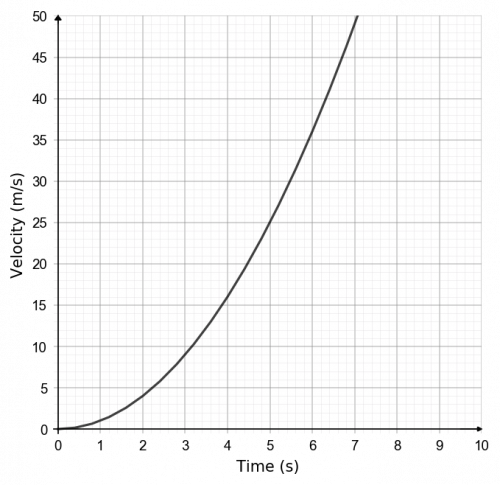
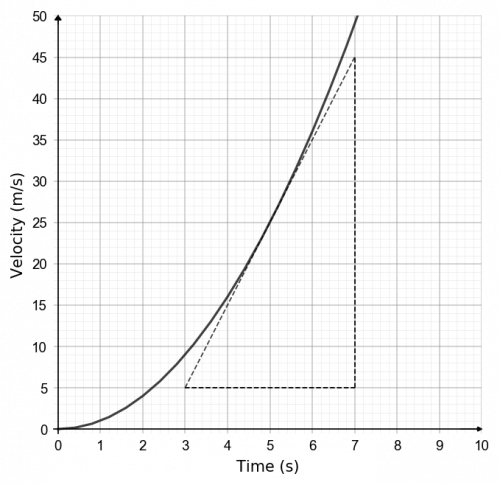
To find the acceleration at 5 seconds after launch we need to find the gradient of the line at that point. To find the gradient we can draw a large triangle with the hypotenuse being the tangent to the line at x=5. This can be seen below.
Hence,
\dfrac{\text{Change in } y}{\text{Change in } x}= \dfrac{45-5}{7-3} =10 m/s^2
Gradients of Real Life Graphs Worksheet and Example Questions
(NEW) Real Life Graphs Exam Style Questions
Level 4-5Level 6-7GCSENewOfficial MME
MME Premium Membership
£19.99
/monthLearn an entire GCSE course for maths, English and science on the most comprehensive online learning platform. With revision explainer videos & notes, practice questions, topic tests and full mock exams for each topic on every course, it’s easy to Learn and Revise with the MME Learning Portal.
Sign Up Now