Revise
Sin, Cos and Tan Graphs
Sin, Cos and Tan Graphs Revision
Sin, Cos & Tan Graphs
Sine, cosine and tangent graphs are specific graphs you need to be able to identify, understand and draw.
Specifically, the graphs of
y=\textcolor{blue}{\sin} x,\,\,\,\,y=\textcolor{limegreen}{\cos} x,\,\,\,\,\text{and}\,\,\,\,y=\textcolor{red}{\tan} x.
You may be asked to draw graphs for any values of x\degree, these graphs are periodic, which means that after a certain point, the graph follows a pattern and repeats itself over and over.
Make sure you are happy with the following topics before moving on:
Sine Graphs
The graph
y=\sin x between 0\degree and 360\degree
is the graph shown below.
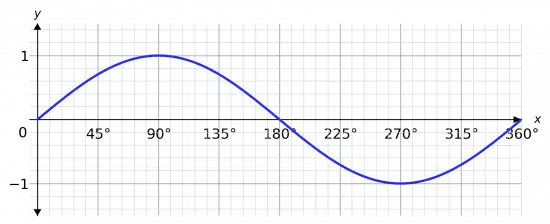
The key features of this graph you need to remember:
- The peak is \mathbf{1} and occurs at \mathbf{90}\degree,
- The minimum is \mathbf{-1} and occurs at \mathbf{270}\degree,
- The graph crosses the axis at \mathbf{0}\degree, \mathbf{180}\degree, and \mathbf{360}\degree.
As mentioned, this is one period, which means that past 360\degree and before 0\degree, it repeats this exact same shape which lasts for 360\degree.
This is shown below.


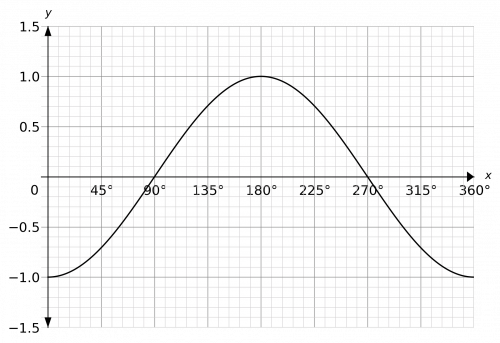
Cosine Graphs
The graph
y=\cos x between 0\degree and 360\degree
is shown below.

The key features of this graph you need to remember:
- The peak is \mathbf{1} and occurs at \mathbf{0}\degree and \mathbf{360}\degree,
- The minimum is \mathbf{-1} and occurs at \mathbf{180}\degree,
- The graph crosses the axis at \mathbf{90}\degree and \mathbf{270}\degree.
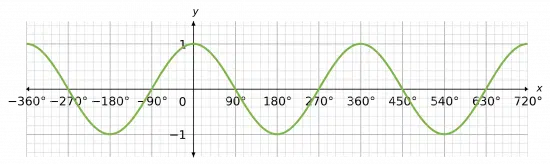
As with the sine graph, this portion is one period of the graph, so it is repeated for all the values before 0\degree and past 360\degree.
If we repeat this period a few times, we will see that the shape is exactly the same as the sine graph.
NOTE: If, at any point, you can remember the general shape of these graphs but can’t remember which graph is which, you can recall/calculate the values of \sin and \cos at zero, and then extend the pattern from there onward.
Tangent Graphs
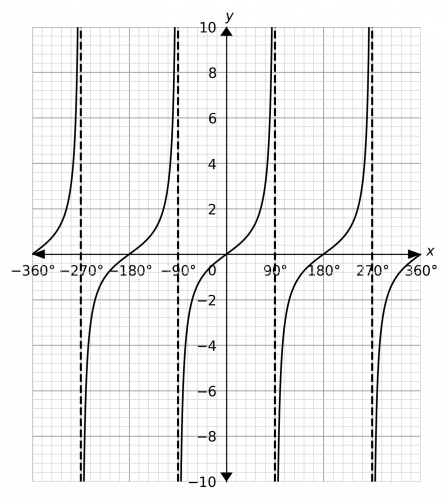
The graph
y=\tan x between -90\degree and 90\degree
is very different, it looks like the graph shown below.

Key things you need to understand about this graph:
- It crosses the axes once at the origin,
- The graph gets very big as the angle gets close to 90\degree, and similarly gets very small as the angle gets close to -90\degree,
- The dotted lines on this graph are asymptotes – lines which the function gets closer and closer to but never quite touches.
As with the previous graphs, this part only represents one period. However, this period repeats every 180\degree, unlike the previous graphs that are repeated every 360\degree.
Note: as the graph repeats, so do the asymptotes.
The result of repeating the shape a few times is shown below.

If anything, this graph is slightly simpler than the previous two, because it only crosses the axis once every 180\degree.
Sin, Cos and Tan Graphs Example Questions
Question 1: On the same axes, plot the functions y=\sin(x) and y=\cos(x) between -180\degree and 180\degree.
[4 marks]
If you can’t remember their shapes, check a few points. So, we have that
\cos(0)=1,\,\,\text{ and }\,\,\cos(90)=0
Which is enough to start of the pattern of the \cos graph. Similarly, we have
\sin(0)=0,\,\,\text{ and }\,\,\sin(90)=1
Which is enough to start the pattern of the \sin graph. If you aren’t sure, just try more values. The resulting graph looks like:
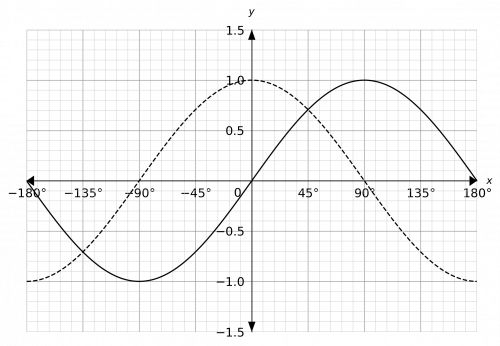
The solid black line represents the \sin graph and the dotted line represents the \cos graph.

Question 2: Plot the function y=\tan(x) from -360\degree to 360\degree.
[2 marks]
The \tan graph has an asymptote at 90\degree, and then again every 180\degree before and after that. Furthermore, we have that \tan(0)=0 and it gets bigger as it gets close to 90\degree. This enough to draw the graph. The result looks like:
Question 3: Plot the function y=-\cos(x) between 0\degree and 360\degree.
[2 marks]
This is a transformation of the form y=-f(x), which corresponds to a reflection in the x axis. In doing this, it would be helpful for you to draw a normal \cos graph, draw the reflection, and then rub out the first one.
To draw the \cos graph, consider that
\cos(0)=1\,\,\text{ and }\,\,\cos(90)=0
This is enough to continue the pattern to 360\degree. The resulting graph should look like
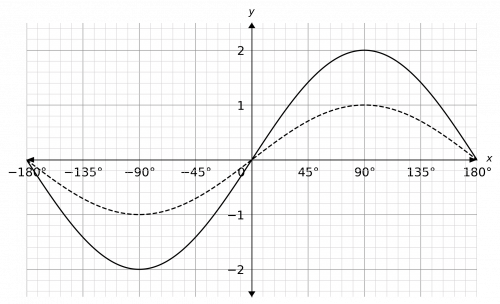
Question 4: Plot the function y=\sin(x) and y=2\sin(x) between -180\degree and 180\degree.
[4 marks]
Here we will plot y=\sin(x) as a dotted line and y=2\sin(x) as a solid line. The resulting graph should look like
Sin, Cos and Tan Graphs Worksheet and Example Questions
(NEW) Sin, Cos and Tan graphs Exam Style Questions - MME
Level 6-7GCSENewOfficial MMESin, Cos and Tan Graphs Drill Questions
Sine Cos and Tan Graphs
Level 6-7GCSE
MME Premium Membership
£19.99
/monthLearn an entire GCSE course for maths, English and science on the most comprehensive online learning platform. With revision explainer videos & notes, practice questions, topic tests and full mock exams for each topic on every course, it’s easy to Learn and Revise with the MME Learning Portal.
Sign Up Now