Revise
Quadratic Inequalities
Quadratic Inequalities Revision
Quadratic Inequalities
Quadratic inequalities are inequalities that involve a squared term. It is important to remember that there are two solutions to such inequalities. As with linear inequalities, we can rearrange them to find solutions similar to if they were equations.
Before going further, you should be familiar with the following topics:
- Inequalities on a Number Line
- Solving Inequalities
- Factorising Quadratic Equations
- Solving Quadratic Equations
Type 1: Algebraically solving x^2\lt a^2
Example: Solve the inequality x^2 \lt 64
When solving quadratic inequalities it is important to remember there are two roots. If the question was solve x^2=a^2 we would simple take the square root of both sides so that x=\pm a.
The range of values that satisfy the inequality is between -8 and 8. This can be expressed as,
-8 \lt x \lt 8


Type 2: Algebraically solving x^2\gt a^2
Solve the inequality 2x^2 \gt 18
Here we have to divide both sides of the equation by 2 so that x^2 \gt 9
The values that satisfy this inequality are
x \lt -3 or x \gt 3
Type 3: Graphically solving x^2\lt a^2
Solve the inequality x^2-2x-3<0.
The first step is to factorise this quadratic and find the solutions.

1\times(-3)=-3 and 1+(-3)=-2
the inequality becomes, (x+1)(x-3)<0
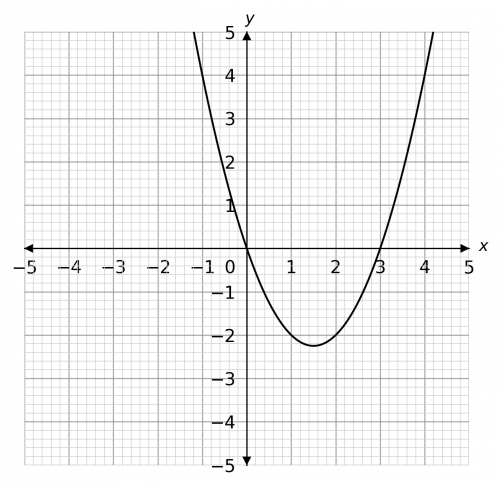
Using this information, we can sketch the graph of y= x^2-2x-3.
The question is asking for a solution to x^2-2x-3<0. In other words when does the graph go below zero on the y-axis?
Looking at the graph, we can see that it drops below zero when x is bigger than -1 but smaller than 3.
The inequality is satisfied for values of x that fall strictly between -1 and 3, so we write the solution as
-1 \lt x \lt 3.
Type 4: Graphically solving x^2\gt a^2
Solve the inequality x^2+5x\geq-4.
To solve this quadratic inequality we first have to rearrange by adding 4 to both sides so that

x^2+5x+4\geq0
Observing that 1\times4=4 and 1+4=5, we can factorise this to be (x+1)(x+4)\geq0
Using this information, we can sketch the graph of y=x^2=5x+4.
Since the inequality is now x^2+5x+4\geq0, the question becomes: when does the graph go above zero on the y-axis?
We can see that when x is less than -4 and bigger than -1 it is above zero. Therefore,
x\leq-4\,\text{ or }\,x\geq-1
This solution has a different structure to the last one, and you must include the ‘or’. It isn’t possible for x to be both below -4 and above -1 at the same time, so the ‘or’ is required.
Take Note:
When answering questions about quadratic inequalities, a general rule of thumb is,
- when x^2\gt a^2 then x\gt a or x\lt-a
- when x^2 \lt a^2 then -a\lt x\lt a
Quadratic Inequalities Example Questions
Question 1: Solve the inequality x^2-5x+6\leq0
[3 marks]
So, we will factorise this quadratic, and then use what would be the solutions to help us plot the graph. Observing that (-2)\times(-3)=6 and (-2)+(-3)=-5, we get that inequality can be written as,
\begin{aligned}x^2-5x+6&\leq0 \\(x-2)(x-3)&\leq0\end{aligned}
So, the roots of this quadratic would be x=2 and x=3, therefore the graph looks like
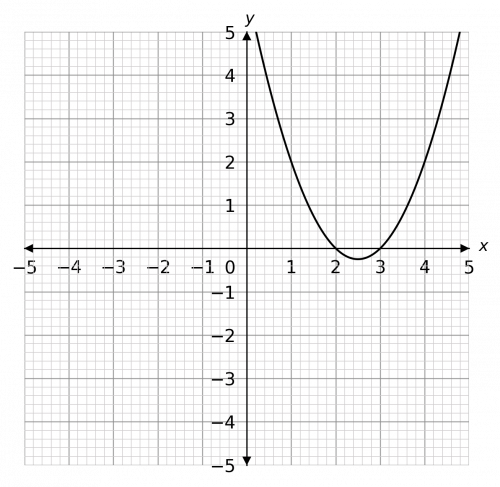
The inequality in the question is x^2-5x+6\leq0, so the question is: when does the graph go below zero? We can see that it goes below zero when x is between 2 and 3. Therefore, the solution is,
2\leq x\leq3

Question 2: Solve the inequality x^2-3x>0
[3 marks]
So, we will factorise this quadratic, and then use what would be the solutions to help us plot the graph.
Taking x out as a factor, we get
\begin{aligned}x^2-3x&>0 \\x(x-3)&>0\end{aligned}
So, the roots of this quadratic would be x=0 and x=3, therefore the graph looks like
The inequality in the question is x^2-3x>0, so the question is: when does the graph go above zero? We can see that it goes above zero when x is less than 0 and also when x is above 3. Therefore, the solution is,
x<0\,\text{ or }\,x>3
Question 3: Solve the inequality 3p^2 + 8> 20
[3 marks]
We solve this inequality by simply rearranging it to make p the subject,
\begin{aligned}3p^2+8 &> 20 \\ 3p^2 &> 12 \\ p^2&>4 \end{aligned}
Hence p can take any value greater than 2, p>2 or less than -2, p<-2, therefore the graph looks like,
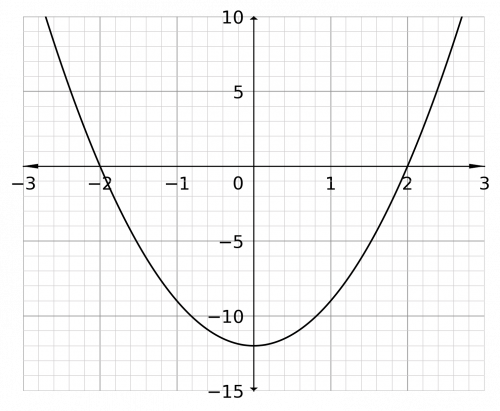
The inequality in the question is 3p^2-12>0, so the question is: when does the graph go above zero? We can see that it goes above zero when p is less than -2 and also when p is above 2. Therefore, the solution is,
p<-2\,\text{ or }\,p>2
Question 4: Solve the inequality x^2-3x+2<0
[3 marks]
We solve this inequality by simply rearranging it to make x the subject,
\begin{aligned}x^2-3x+2&<0 \\ (x-2)(x-1)&<0 \end{aligned}
Hence x can take any value between 1<x<2
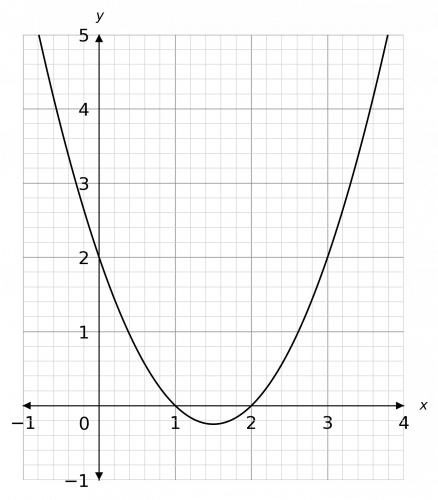
The inequality in the question is x^2-3x+2<0, so the question is: when does the graph go below zero? We can see that it goes below zero between the values x is greater than 1 and x is less than 2. Therefore, the solution is,
1<x<2
Question 5: Solve the inequality x^2-5x+24<5x+8
[3 marks]
We solve this inequality by simply rearranging it to make x the subject,
\begin{aligned}x^2-5x+24&<5x+8 \\ x^2-10x+16&<0 \\ (x-8)(x-2)&<0\end{aligned}
Hence x can take any value between 2<x<8
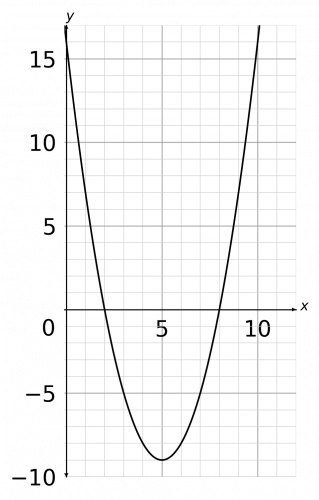
The inequality in the question is x^2-10x+16<0, so the question is: when does the graph go below zero? We can see that it goes below zero between the values x is greater than 2 and x is less than 8. Therefore, the solution is,
2<x<8
